
Cynnwys
- Main points
- Economist’s comment
- Things you need to know about this release
- Labour productivity up in the third quarter of 2016, but the puzzle remains
- Output per hour up for services, but down for manufacturing
- Unit labour costs grow for the sixth consecutive quarter
- Links to related statistics
- What’s changed in this release?
- Quality and methodology
1. Main points
UK labour productivity, as measured by output per hour, is estimated to have grown by 0.4% from Quarter 2 (Apr to June) 2016 to Quarter 3 (July to Sept) 2016; looking over a broader period the “productivity puzzle” remains, with growth on average lower than prior to the downturn.
Productivity grew in the services industries but not in the manufacturing industries; services productivity is estimated to have grown by 0.3% on the previous quarter, while manufacturing productivity is estimated to have fallen by 0.2% on the previous quarter.
Earnings and other labour costs growth outpaced productivity growth, resulting in unit labour cost (ULC) growth of 2.3% in the year to Quarter 3 2016.
This edition forms part of our quarterly productivity bulletin which also includes an overarching commentary, summaries of recently published estimates and new quarterly estimates of public service productivity.
Nôl i'r tabl cynnwys2. Economist’s comment
”These estimates of productivity show that while labour productivity is improving, particularly in the services sector, it is still weak compared to that experienced in the recent past, both in terms of the level of productivity and the rate of growth. ONS is continuing to explore potential reasons for this.”
Richard Heys, Deputy Chief Economist, ONS
Nôl i'r tabl cynnwys3. Things you need to know about this release
This release reports labour productivity estimates for Quarter 3 (July to Sept)1 2016 for the whole economy and a range of industries, together with estimates of unit labour costs. Productivity is important as it is arguably the most important determinant of long-run improvements in average living standards.
Labour productivity is calculated by dividing output by labour input. Output refers to gross value added (GVA), which is an estimate of the volume of goods and services produced by an industry, or the UK as a whole. Labour inputs in this release are measured in terms of workers, jobs (“productivity jobs”) and hours worked (“productivity hours”).
This release also reports estimates of unit labour costs (ULCs), which capture the full labour costs – including social security and employers’ pension contributions – incurred in the production of a unit of economic output. Labour costs make up around two-thirds of the overall cost of production of UK economic output. Changes in labour costs are therefore a large factor in overall changes in the cost of production. If increases in labour costs are not reflected in the volume of output, this can put upwards pressure on the prices of goods and services – sometimes referred to as “inflationary pressure”. ULCs are therefore a closely watched indicator of inflationary pressure in the economy.
The technical equations for labour productivity and ULCs can be found in the Quality and methodology section.
The output statistics in this release are consistent with the latest Quarterly National Accounts published on 23 December 2016. Note that productivity in this release does not refer to gross domestic product (GDP) per person, which is a measure including people who are not in employment.
The labour input measures used in this release are consistent with the latest Labour Market Statistics as described further in the Quality and methodology section of this bulletin. Measures of jobs and hours worked in this release are affected by revisions from data sources feeding into workforce jobs. These affect the industry splits of jobs and hours worked, as well as the whole-economy estimate for jobs.
Unless otherwise stated all figures are seasonally adjusted.
Our productivity teams are running a user group to discuss the development of the labour productivity statistics which we produce. The event will take place on 16 March 2017, and the group will cover recent developments undertaken by the productivity teams, including:
- the incorporation of a new market methodology for estimates of labour input
- new quarterly regional labour input estimates – both in aggregate and by industry
- recently published analyses of productivity
- plans for future work
To register for the user group, please email productivity@ons.gov.uk, including any information on your access needs and dietary requirements.
Notes for: Things you need to know about this release
- Q1 refers to Quarter 1 (Jan to Mar), Q2 refers to Quarter 2 (Apr to June), Q3 refers to Quarter 3 (July to Sept), and Q4 refers to Quarter 4 (Oct to Dec).
4. Labour productivity up in the third quarter of 2016, but the puzzle remains
Productivity – as measured by output per hour – grew by 0.4% in Quarter 3 (July to Sept) 2016. Productivity in Quarter 3 2016 was consequently 1.1% higher than in Quarter 1 (Jan to Mar) 2008, immediately prior to the recent economic downturn.
Quarterly growth of 0.4% is below the 1994 to 2007 average – which even taken together with recent stronger quarters, provides little sign of an end to the UK's “productivity puzzle”. The term productivity puzzle refers to the relative stagnation of labour productivity since the recent economic downturn. This is in contrast with patterns following previous UK economic downturns where productivity initially fell, but subsequently returned to the previous trend. There is wide and varied economic debate regarding the causes of this puzzle, and further analysis of recent UK productivity trends can be found in our January 2016, May 2016 and June 2016 Economic Review, and also in several standalone articles including: What is the productivity puzzle?, The productivity conundrum, explanations and preliminary analysis, and The Productivity Conundrum, Interpreting the Recent Behaviour of the Economy.
This puzzle is illustrated by Figure 1, which shows 2 alternative measures of productivity – output per hour and output per worker – alongside their projected 1994 to 2007 trends. Following years of steady growth, each measure peaked in Quarter 4 (Oct to Dec) 2007 and fell during the economic downturn. However, due to a strong labour market performance accompanying a relatively weak recovery in output growth, productivity has not returned to the pre-downturn trend. Productivity in Quarter 3 2016, as measured by output per hour, stood 15.5% below its pre-downturn trend – or, equivalently, productivity would have been 18.4% higher had it followed this pre-downturn trend.
Figure 1: Output per hour and output per worker
Seasonally adjusted, Quarter 1 (Jan to Mar) 1994 to Quarter 3 (July to Sept) 2016, UK
Source: Office for National Statistics
Notes:
- Economic downturn = Quarter 2 (Apr to June) 2008 to Quarter 2 2009.
Download this chart Figure 1: Output per hour and output per worker
Image .csv .xlsFigure 2 breaks down the growth in productivity between Quarter 1 2008 and Quarter 3 2016 into contributions from different industry groupings, and an “allocation effect” due to changes in the share of output and labour in each grouping. All else equal, stronger (weaker) productivity growth in any given industry, or a movement of output and labour towards (away from) higher productivity industries will tend to raise (reduce) aggregate productivity growth. Non-financial services stand out as the main positive contributor to productivity growth over the period, while negative contributions from non-manufacturing production and finance largely offset this. The negative allocation effect – suggesting that output and labour have been moving away from the highest productivity industries in recent years – partly captures the falling share of output in mining and quarrying, which has among the highest levels of productivity of UK industry.
Figure 2: Contributions to growth of whole economy output per hour
Seasonally adjusted, cumulative since Quarter 1 (Jan to Mar) 2008, Quarter 3 (July to Sept) 2016, UK
Source: Office for National Statistics
Notes:
- Non-manufacturing production refers to: 1) Agriculture, Forestry and Fishing, 2) Mining and Quarrying, 3) Electricity, Gas, Steam and Air Conditioning Supply, and 4) Water Supply, Sewerage, Waste Management and Remediation Activities.
Download this chart Figure 2: Contributions to growth of whole economy output per hour
Image .csv .xls5. Output per hour up for services, but down for manufacturing
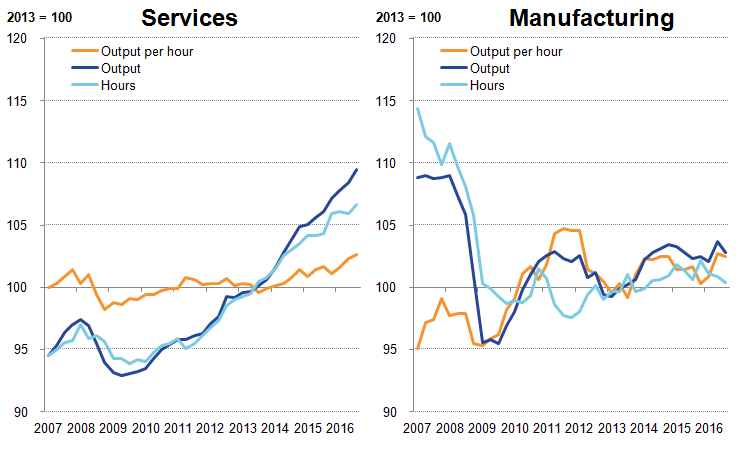
Manufacturing output per hour decreased in Quarter 3 (July to Sept) 2016, reflecting a larger fall in output than the fall in hours. In contrast, rising services output per hour reflected an increase in both output and hours, with the increase in output being larger. Output per hour in manufacturing and services grew at similar rates in Quarter 3 2016, but in opposite directions – manufacturing falling by 0.2% and services growing by 0.3%.
Figure 3 examines longer-term trends, showing output per hour and its components since Quarter 1 (Jan to Mar) 2008. Services are represented in the first panel, while manufacturing is represented in the second. Manufacturing output per hour has been more volatile than services in recent years. This reflects a divergence of manufacturing gross value added (GVA) and hours, most pronounced in 2009 and 2011 to 2012, whereas GVA and hours for services follow fairly similar trends. However, in recent quarters services GVA grew faster than hours, potentially marking a break from this trend.
Figure 3: Components of manufacturing and services productivity measures
Seasonally adjusted, UK, Quarter 1 (Jan to Mar) 2007 to Quarter 3 (July to Sept) 2016
Source: Office for National Statistics
Download this image Figure 3: Components of manufacturing and services productivity measures
.png (28.0 kB) .xls (20.5 kB)
6. Unit labour costs grow for the sixth consecutive quarter
Unit labour costs (ULCs) reflect the full labour costs, including social security and employers’ pension contributions, incurred in the production of a unit of economic output. Changes in labour costs are a large factor in overall changes in the cost of production. If increased costs are not reflected in increased output, for instance, this can put upward pressure on the prices of goods and services – sometimes referred to as “inflationary pressure”. ULCs grew by 2.3% in the year to Quarter 3 (July to Sept) 2016, reflecting a larger percentage increase in labour costs per hour than output per hour.
Figure 4 shows changes in ULCs since Quarter 1 (Jan to Mar) 2008 on a quarter on same quarter a year earlier basis. The bars represent the contribution to changes in ULCs from changes in labour costs per hour and changes in output per hour. Holding other factors constant, increasing output per hour reduces unit labour costs – as total labour costs remain constant while output rises. As a result, output per hour has its sign reversed in Figure 4. In this presentation, positive (negative) output per hour growth has a negative (positive) effect on ULC growth.
While growth in ULCs has been broadly positive since the period following the recent economic downturn, averaging around 1.5% since Quarter 1 2008, there has been substantial variation. During the recent economic downturn ULCs began to grow at a relative high rate, reaching a peak of 6.8% by the end of the downturn in Quarter 2 (Apr to June) 2009 and remaining elevated until Quarter 1 2010. Figure 4 shows that the initial increase in ULC growth during the downturn was driven by falling output per hour, but from Quarter 2 2009 onwards increasing labour costs per hour were the driving factor. Following the downturn, growth in ULCs began to slow, eventually becoming negative in Quarter 4 (Oct to Dec) 2010. Since then ULC growth has been either low or negative, reflecting both low growth in hourly labour costs and productivity. The most recent quarterly observations are at the higher end of the range observed since 2011 – and are notably stronger than 2 years earlier – but have been relatively stable.
Figure 4: Whole economy unit labour costs and their compositions, growth on quarter a year ago
Seasonally adjusted, UK, Quarter 1 (Jan to Mar) 2008 to Quarter 3 (July to Sept) 2016
Source: Office for National Statistics
Notes:
- Labour costs per hour estimates will differ from those in the ONS bulletin Index of Labour Costs per Hour due to differences in methodology.
Download this chart Figure 4: Whole economy unit labour costs and their compositions, growth on quarter a year ago
Image .csv .xls8. What’s changed in this release?
Several sources of revisions affecting workforce jobs have been implemented, including a benchmark of employees to the Business Register and Employment Survey (BRES) in 2015, revised seasonal adjustment, changes to public sector employment, the reweighting of the Labour Force Survey, improvements in the coverage of the business survey population, and changes in the source for data on government-supported trainees.
These have no effect on whole-economy estimates of hours worked, and a minimal effect on estimates of whole-economy productivity jobs. The impact on industry estimates is larger beginning in 2015 – the period from which the annual benchmark to BRES takes effect. Prior to 2015, the impact on industry estimates is minimal.
Nôl i'r tabl cynnwys9. Quality and methodology
The measure of output used in these statistics is the chain volume (real) measure of gross value added (GVA) at basic prices, with the exception of the regional analysis in Table 9, where the output measure is nominal GVA (NGVA). These measures differ because NGVA is not adjusted to account for price changes; this means that if prices were to rise more quickly in 1 region than the others, then this would be reflected in apparent improved measured productivity performance in that region relative to the others.
Labour input measures used in this bulletin are known as “productivity jobs” and “productivity hours”. Productivity jobs differ from the Workforce Jobs (WFJ) estimates published in Table 6 of our labour market statistical bulletin, in 3 ways:
to achieve consistency with the measurement of GVA, the employee component of productivity jobs is derived on a Reporting Unit (RU) basis, whereas the employee component of the WFJ estimates is on a Local Unit (LU) basis
productivity jobs are scaled so industries sum to total Labour Force Survey (LFS) jobs – note that this constraint is applied in non-seasonally adjusted terms; the nature of the seasonal adjustment process means that the sum of seasonally adjusted productivity jobs and hours by industry can differ slightly from the seasonally adjusted LFS totals
productivity jobs are calendar quarter average estimates whereas WFJ estimates are provided for the last month of each quarter
Productivity hours are derived by multiplying employee and self-employed jobs at an industry level (before seasonal adjustment) by average actual hours worked from the LFS at an industry level. Results are scaled so industries sum to total unadjusted LFS hours, and then seasonally adjusted. Labour productivity is then derived using growth rates for GVA and labour inputs in line with the following equation:
Industry estimates of average hours derived in this process differ from published estimates (found in Table HOUR03 in the labour market statistics release) as the HOUR03 estimates are calculated by allocating all hours worked to the industry of main employment, whereas the productivity hours system takes account of hours worked in first and second jobs by industry.
Whole-economy ULCs are calculated as the ratio of total labour costs (that is, the product of labour input and costs per unit of labour) to GVA. Further detail on the methodology can be found in revised methodology for unit wage costs and unit labour costs: explanation and impact. The equation for growth of ULCs can be calculated as:
Manufacturing unit wage costs are calculated as the ratio of manufacturing average weekly earnings to manufacturing output per filled job. On 28 November 2012 we published Productivity measures: sectional unit labour costs, describing new measures of ULCs below the whole economy level, and proposing to replace the currently published series for manufacturing unit wage costs with a broader and more consistent measure of ULCs.
A research note, Sources of revisions to labour productivity estimates, is available on the archived version of our website, and further commentary on the nature and sources of the revisions introduced in this quarter is available in the UK Productivity Bulletin – Introduction.
The Labour Productivity Quality and Methodology Information document contains important information on:
- the strengths and limitations of the data and how it compares with related data
- uses and users of the data
- how the output was created
- the quality of the output including accuracy of the data
Manylion cyswllt ar gyfer y Bwletin ystadegol
Related publications
- Productivity flash estimate and overview, UK: October to December 2023 and July to September 2023
- Volume index of UK capital services (experimental): estimates to Quarter 2 (Apr to Jun) 2017
- Regional firm-level productivity analysis for the non-financial business economy: Jan 2017
- Regional and sub-regional productivity in the UK: Jan 2017
- Management practices and productivity in British production and services industries - initial results from the Management and Expectations Survey: 2016
- Public service productivity: quarterly, UK, October to December 2019
- Public service productivity: total, UK, 2021
- Public service productivity: total, UK, 2021