1. Main points
The UK labour market showed signs of slowing, with the level of employment falling by 56,000 to 32.69 million and the level of unemployment increasing by 22,000 to 1.31 million, in the three months to August 2019.
Over the same period, the employment rate for men remained unchanged (80.2%) and that for women declined to 71.6%.
The total number of people working part-time fell by 129,000 on the quarter, which is the largest fall since the three months to August 2011.
The unemployment to vacancy ratio has increased slightly in the latest period, which may be an early indication that the labour market tightness is levelling out.
In the three months to August 2019, both real regular pay and real total pay were below their pre-downturn peaks.
2. Overview of the labour market
The UK labour market showed signs of slowing in the three months to August 2019, with the level of employment falling by 56,000, the level of unemployment increasing by 22,000, and the level of inactivity increasing by 57,000. However, compared with the same three months a year ago, the level of employment rose by 282,000, while the levels of unemployment and inactivity declined by 49,000 and 63,000 respectively. Vacancy levels decreased, while average weekly earnings continued to grow.
External surveys indicate that economic and political uncertainties are impacting on firms’ hiring intentions. The recent British Chambers of Commerce survey (PDF, 443KB) of its members reported that in the event of the UK leaving the EU without a formal agreement, 22% of firms reported that they will revise their hiring intentions down, while only 3% of firms indicate they will revise recruitment plans up.
The KPMG and REC Report on UK jobs (PDF, 266KB) reinforces the view that ongoing uncertainties are impacting on recruitment.The demand for permanent staff grew at its slowest rate in seven years, while the demand for temporary staff fell. Growth in vacancies slowed to its lowest since 2012. At a regional level, the Midlands, north and south of England saw decreases in permanent placements, though London bucked the trend. Greater competition for staff continues to push up starting salaries.
The August 2019 NatWest Regional PMI (PDF, 337KB) reported that the Yorkshire and The Humber region led on employment growth, followed by London, East of England and the North West, though job creation slowed in all the regions. The Royal Bank of Scotland Report on Jobs (PDF, 734KB) for September 2019 indicated that in Scotland permanent placements fell for the second month running, with firms turning to short-term placements to fill roles. In Northern Ireland, the Ulster Bank PMI (PDF, 456KB) reported that employment fell for the eighth consecutive month.
The Open University Business Barometer Report 2019 showed that 63% of firms are experiencing skill shortages. Firms report that it is taking around two months to fill posts with workers with appropriate skills. The recruitment to management and leadership roles pose the biggest challenge. Firms are not expecting an improvement soon. Increased competition, an ageing population and uncertainty around the UK’s withdrawal from the EU are reported as contributory factors to the recruitment challenges. Over the year, firms have spent £4.4 billion on recruitment fees, with London-based firms spending the most.
Nôl i'r tabl cynnwys3. Latest labour market estimates
In the latest period, June to August 2019, the UK labour market showed signs of slowing. However, unemployment remained historically low, and wage growth persisted.
Employment
The UK labour market showed signs of slowing, with employment falling by 56,000 to 32.69 million in the three months to August 2019. This was the first quarterly decrease since the three months to October 2017.
The fall in employment was caused by changes in the numbers of men and women. The number of women entering employment has been a strong contributing factor to the current high employment levels, so a fall in their number in employment has had a larger impact on the current level of employment .
There was a decrease in the employment of young people (aged 16 to 24 years) on the quarter. The number of people working full-time increased by 73,000 to 24.16 million, while the number of people working part-time fell by 129,000 to 8.53 million. The fall in the number of part-time workers is the largest decrease since the three months to August 2011 and is the main reason for the fall in employment in the three months to August 2019.
Reasons for working part-time
Figure 1 shows the proportion of part-time working men and women who could not find full-time jobs. For men who worked part-time 17.3% did so because they could not find a full-time job. A much smaller proportion of women who worked part-time (7.9%) did so for the same reason.
Figure 1: Proportion of part-time workers who could not find full-time jobs has continued to fall for both men and women
The proportion of part-time workers who could not find full-time jobs, UK, seasonally adjusted, March to May 1992 to June to August 2019
Source: Office for National Statistics – Labour Force Survey
Download this chart Figure 1: Proportion of part-time workers who could not find full-time jobs has continued to fall for both men and women
Image .csv .xlsThe proportion of employees working part-time has fallen consistently since the three months to July 2013, indicating continued tightening of the labour market and falling under-employment.
Unemployment
The number of unemployed people in the UK aged 16 years and older increased by 22,000 to 1.31 million in the three months to August 2019. Although the most recent figures indicate a slight increase in unemployment, the rate is still low by historical standards.
Under-and over-employment
The unemployment rate is an indicator of spare capacity in the economy. The record-low unemployment rate and high vacancy rate in recent periods could mean that those currently in employment might be working more than they would like, implying that they could be over-employed. It is useful to investigate if those currently in employment would like to work a different number of hours from their current hours.
Figure 2 shows the under- and over-employment rates, calculated as the ratio of the number of those employed who would like to work more hours or less hours respectively to the number of all people in employment. The figure shows that before the economic downturn the over-employment rate was higher than the under-employment rate. Those in employment in general wanted to work fewer hours than they were working at the time. This, together with a relatively low unemployment rate, indicates that there was little spare capacity in the economy.
Figure 2: From the three months to June 2014, those in employment generally wanted to work less hours than they worked
Under- and over- employment rates, UK, January to March 2002 to April to June 2019¹
Source: Office for National Statistics – Labour Force Survey
Notes:
- Latest figures available. Next release 12 November 2019.
Download this chart Figure 2: From the three months to June 2014, those in employment generally wanted to work less hours than they worked
Image .csv .xlsAfter the onset of the economic downturn in early 2008, the over-employment rate started falling while the under-employment increased. From early 2009 to the three months to June 2014, the under-employment rate was generally higher than the over-employment rate. In this period, those in employment in general wanted to work more hours than they were at the time.
The under-employment rate has been volatile but on a downward trend from the three months to March 2014 onwards, reaching a low of 7.4% in the three months to June 2018 and steadying around that level since.
Under- and over-employment rates can mask the differences between the aggregate amounts of more and fewer hours that those who feel under- and over-employed want to work. To get around this, Figure 32 shows the total additional weekly hours for those who are under-employed and the total fewer weekly hours those who are over-employed would like to work. It generally shows the same pattern of over-employment before the economic downturn as Figure 2. However, it illustrates that under-employment and hence spare capacity in the labour market has persisted for much longer when looked at in more detail.
Figure 3: In the latest periods, total additional weekly hours desired have become close to total fewer weekly hours desired
Under- and over- employment hours, UK, January ³ to March 2002 to April to June 2019
Source: Office for National Statistics – Labour Force Survey
Download this chart Figure 3: In the latest periods, total additional weekly hours desired have become close to total fewer weekly hours desired
Image .csv .xlsThe total additional weekly hours desired have been greater than the total fewer weekly hours desired between the three months to June 2008 and the three months to December 2017. On an hourly basis, there was more spare capacity in the labour market than on a person basis following the economic downturn. This could potentially explain why real wage growth has not been as strong in the post-downturn period compared with the pre-downturn period. It could also potentially explain why it took longer than expected for real wage growth to accelerate in recent periods. Another possible explanation for weaker than expected earnings growth in the post-downturn period could be the persistently weaker growth of UK’s labour productivity.
Economic inactivity
In the three months to August 2019, the level of economic inactivity in the UK increased by 57,000 to 8.68 million. The inactivity rate increased by 0.1 percentage points to 3.9%. The increase in economic inactivity was entirely among women. Figure 4 disaggregates the different categories of economic inactivity by sex.
Figure 4: A higher proportion of inactive men were students, while proportionally more inactive women looked after family or home
Percentage of inactivity by sex and reason, UK, three months to August 2019
Source: Office for National Statistics – Labour Force Survey
Download this chart Figure 4: A higher proportion of inactive men were students, while proportionally more inactive women looked after family or home
Image .csv .xlsFigure 4 shows the percentages of inactive people by reason for inactivity disaggregated by sex. It shows that a higher proportion of inactive men (35%) were students and that of women (33%) looked after family or home.
Notes for: Latest labour market estimates
- Underemployment rate as the proportion of total employment with no adjustments for unknowns.
- Latest figures available. Next release 12 November 2019.
- Data sourced from: ONS dataset, Under and over employment by more or less hours wanted – AJ96 to AJ19
4. The Beveridge curve
In the recent period, unemployment has remained at historically low levels (although it increased in the three months to August 2019), while vacancies have slowly started decreasing. Figure 5 shows the unemployment to vacancy ratio, an indicator of the demand for and supply of labour in the UK.
An increase in the ratio indicates a loosening of the labour market, as relatively more unemployed people become available to fill vacancies, there is less competition between employers for labour, and hence less upward pressure on wages. The reverse is expected when the unemployment to vacancy ratio falls, indicating a tighter labour market.
Figure 5: Unemployment to vacancy ratio has increased slightly from the lowest level of 1.5 to 1.6 in the latest period.
Unemployment to vacancy ratio, UK, April to June 2001 to June to August 2019
Source: Office for National Statistics – Labour Force Survey,Vacancy Survey
Download this chart Figure 5: Unemployment to vacancy ratio has increased slightly from the lowest level of 1.5 to 1.6 in the latest period.
Image .csv .xlsFrom mid-2001 to mid-2008, the unemployment to vacancy ratio averaged 2.4 unemployed persons per vacancy. The ratio increased dramatically following the 2008 economic downturn. During the economic downturn and a few years following it, there was weak demand for labour and a lot of spare capacity.
Since early 2012, the unemployment to vacancy ratio started declining rapidly reflecting employers’ strengthening confidence following the economic recovery. The UK labour market has been tighter than the pre-economic downturn average since mid-2015. In the latest period, the ratio increased slightly, which may be an early indication that the labour market tightness is levelling out.
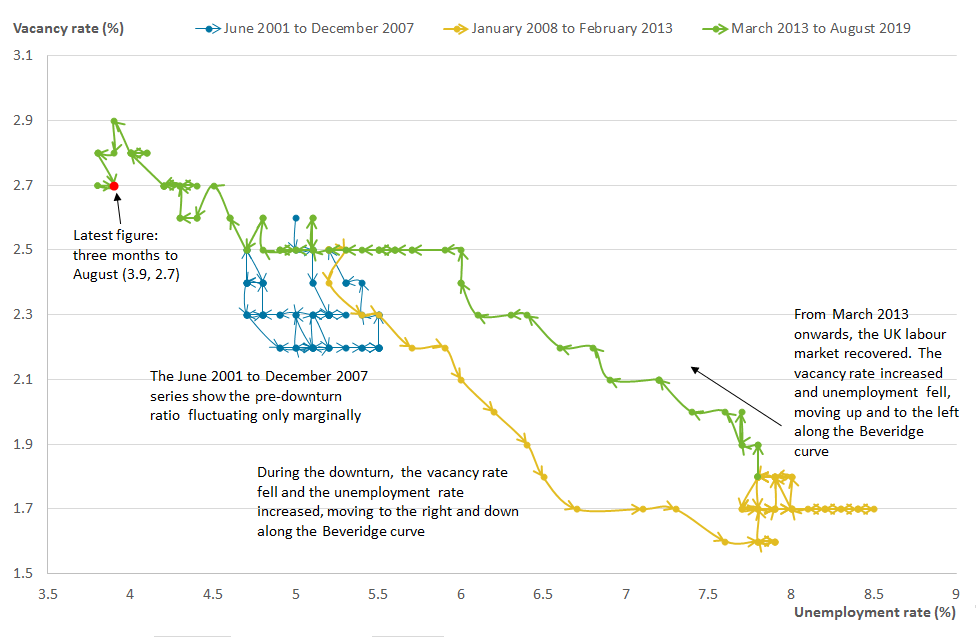
The same information from Figure 5 can be presented in a different format to produce the Beveridge curve, which shows the negative relationship between the vacancy rate and the rate of unemployment, as shown in Figure 6. Each data point represents an observation for a three-month period up to that point for both vacancy and unemployment rates. The curve is split into three distinctive periods: June 2001 to December 2007, January 2008 to February 2013, and March 2013 to August 2019, corresponding to the tightness and slackness in the labour market over different periods.
Figure 6: The Beveridge curve may be starting to shift downwards
The Beveridge curve, UK, April to June 2001 to June to August 2019
Source: Office for National Statistics – Labour Force Survey, Vacancy Survey
Download this image Figure 6: The Beveridge curve may be starting to shift downwards
.png (71.6 kB) .xlsx (32.1 kB)
Prior to the economic downturn, the unemployment rate hovered around 5.1% and the vacancy rate around 2.3%. During the economic downturn and in the few years following it, the unemployment rate started to increase, and the vacancy rate started to fall, moving to the right and down along the Beveridge curve.
The UK labour market began to move up and along the left of the Beveridge curve from late 2013, as the unemployment rate started falling and the vacancy rate increased. Interestingly, there is a higher vacancy rate per unemployment rate in the post-downturn period. In other words, the Beveridge curve for the UK labour market shifted out from the origin, which is usually associated with increased inefficiency in the labour market. Labour market inefficiency generally increases when it takes longer to find a job, or when it is difficult to fill a vacancy because the applicants do not have the required skills for the role, or when employers hold off on hiring due to uncertainty about the future.
Since the three months to June 2019, the vacancy rate has fallen slightly while unemployment has remained at a record low, indicating that there may have been an increase in labour market efficiency. This could be temporary if firms are cautious about hiring intentions as indicated by external surveys.
Nôl i'r tabl cynnwys5. Average weekly earnings
Average weekly earnings (AWE) have continued to grow, with total average weekly pay, which includes bonuses, increasing by 3.8% in the year to August 2019 to £542. Regular average weekly pay, which excludes bonuses, increased by 3.8% to £509 over the same period.
Figure 7 shows the annual growth rates of real and nominal average weekly earnings. Real pay (that is, pay that has been deflated with the Consumer Prices Index including owner occupiers’ housing costs (2015=100)) grew by an average 2.1%, and nominal pay grew by an average 4.0% from early 2001 up to the economic downturn.
Nominal and real wage growth rates began to increase in late 2014 after the labour market started tightening. Even though both nominal and real regular pay growth have been rising, they were still below their pre-downturn averages in the three months to August 2019.
Figure 7: The growth rates of nominal and real regular pay are slowly catching up to their pre-downturn averages
UK, seasonally adjusted, January to March 2001 to June to August 2019
Source: Monthly Wages and Salaries Survey, Consumer price inflation, UK
Download this chart Figure 7: The growth rates of nominal and real regular pay are slowly catching up to their pre-downturn averages
Image .csv .xlsVacancy ratio and wages
Loosening and tightening of labour market conditions seem to be reflected in changes in earnings growth for the whole economy. However, the extent to which this relationship is reflected differs across industries.
Figure 8 shows the annual growth rates of nominal total average weekly earnings and the vacancy ratio for selected industries. An increase in the vacancy ratio, which indicates a higher demand for labour, should in theory be followed by an increase in the growth of earnings, holding other factors constant.
Figure 8: The increase in the vacancy ratio puts upward pressure on total earnings in some industries
Total average weekly earnings and vacancy rate for selected industries, UK, February to April 2001 to June to August 2019

Source: Office for National Statistics –Monthly Wages and Salaries Survey, Vacancy Survey
Download this image Figure 8: The increase in the vacancy ratio puts upward pressure on total earnings in some industries
.png (234.3 kB) .xlsx (109.1 kB)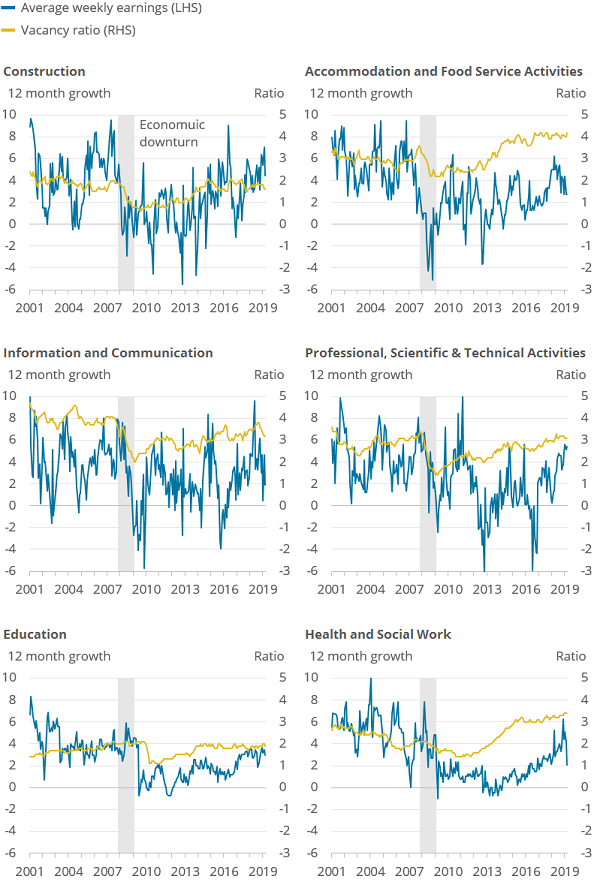
The industries selected for Figure 8 show this relationship to hold generally for the private sector, but this relationship is weaker for the public sector. The vacancy ratio fell during the economic downturn and recovered afterwards, with the growth rate of earnings following the same trend over the period for these industries.
The growth rate of earnings is only just returning to the pre-downturn averages across these selected industries. This is particularly striking for the accommodation and food, and health and social work industries, where the vacancy ratio in the post-downturn period has increased above the pre-downturn level. This could be due to a shortage of labour with the right skills for those industries.
The exception to the timing of the fall in the vacancy rate and earnings growth rate is the education industry. Earnings started growing in the education industry (in late 2009) before the vacancy rate started rising in late 2010.
Nôl i'r tabl cynnwys