1. Main points
The number of people in employment in the UK continued to grow in the 3 months ending December 2016, but the increase is smaller than the recent past.
The unemployment rate remains at its lowest in more than a decade.
The number of vacancies has remained steady since early 2015, suggesting stable labour demand.
Wage growth increased in the year to December but, after adjusting for inflation, the pace of real earnings growth weakens.
The UK labour market statistical bulletin includes a breakdown of employment by country of birth and by nationality, and relates to persons resident in private households. This is distinct from data on migration flows. The first migration figures that include a post-referendum period will be published on 23 February, when the Office for National Statistics will release migration statistics for the year ending September 2016.
Nôl i'r tabl cynnwys2. UK economy continues to add jobs in the 3 months ending December 2016
The number of people in work increased by 37,000 in the 3 months to December 2016 to 31.84 million, with an increase in full-time employment (positive 45,000) partly offset by a fall in part-time employment (negative 7,000). Following 6 consecutive quarters of growth, the employment rate reached a new record high of 74.6%. However, the pace of employment growth in the second half of 2016 has moderated from the average rate experienced over 2012 to 2015 (Figure 1).
Other measures of labour market activity remained relatively stable in the 3 months ending December 2016. Average weekly hours worked were 32.1, unchanged from the 3 months ending September 2016. Similarly, the number of vacancies has remained steady since early 2015 after rising strongly over 2012 to 2014. The gross flow from employment to unemployment is the lowest on record, while the ratio of redundancies to employment remains at a low level. Job-to-job flows – an indicator of labour market confidence – declined slightly in the 3 months to December 2016 but is now around its pre-crisis average.
Figure 1: Quarterly change in Employment
UK, seasonally adjusted, Quarter 1 (Jan to Mar) 2008 to Quarter 4 (Oct to Dec) 2016
Source: Office for National Statistics, Labour Force Survey
Download this chart Figure 1: Quarterly change in Employment
Image .csv .xls3. The labour market edges towards full capacity
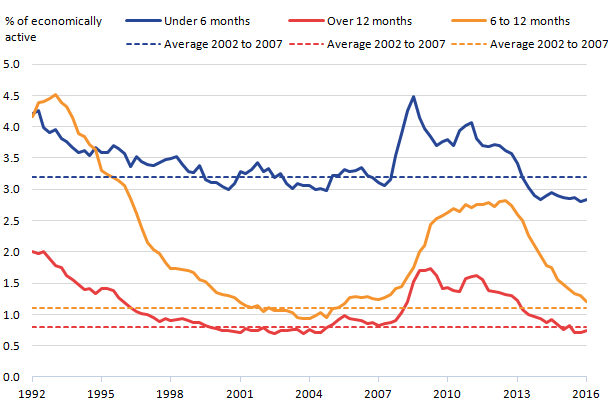
Consistent with ongoing employment gains, the unemployment rate remained at 4.8% in the 3 months to December 2016, its equal lowest level since the 3 months to September 2005. By duration, short-term unemployment as a share of the economically active remained at 2.8% in the quarter, its lowest since 1992, while long-term unemployment as a share of the economically active is approaching its pre-crisis average (Figure 2).
Figure 2: Unemployment as a per cent of economically active, by duration
UK, seasonally adjusted, Quarter 4 (Oct to Dec) 1992 to Quarter 4 (Oct to Dec) 2016
Source: Office for National Statistics, Labour Force Survey
Download this image Figure 2: Unemployment as a per cent of economically active, by duration
.png (19.0 kB) .xlsx (17.3 kB)
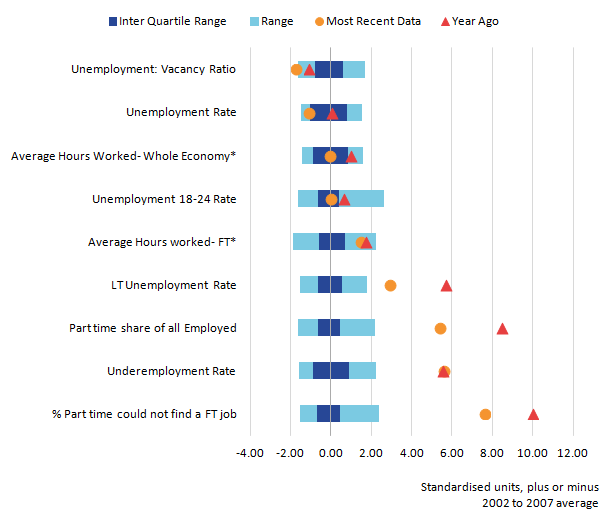
The unemployment rate is now at its lowest in over a decade but wage growth remains subdued by historical standards1, raising questions about the degree of spare capacity in the UK’s labour market. Figure 3 examines a broad range of measures, which can be used to judge the degree of spare capacity. Variables which capture the degree of capacity utilisation – including average hours worked – are inverted to give a measure of spare capacity, and all variables are standardised and shown relative to their long-run average. Dots – which indicate the most recent observation – to the left of the axis indicate lower-than-average spare capacity, while points to the right of the axis indicate higher-than-average spare capacity. Triangles indicate the variables’ value a year ago.
Almost all of the variables show a shift to the left over the last 12 months suggesting a broad- based tightening in the labour market. The unemployment rate, and the ratio of unemployment to vacancies, in particular, both suggest that the labour market is currently tight.
Some measures raise questions about structural changes in the UK labour market. In particular, the proportion of part-time workers who cannot find full-time work is markedly above the long-run average. Combined with the increased share of part-time workers in the economy, this suggests that there may be resources in the labour market that firms can mobilise to increase output. Similarly, the underemployment rate – which captures employees who are available and would like to work more hours – at 8.1%, remains above its pre-crisis average of 6.7%.
Figure 3: Indicators of spare capacity
UK, Standardised units relative to the 2002 to 2007 average
Source: Office for National Statistics, Labour Force Survey
Notes:
All variables are standardised using their average and spread from 2002 to 2007. Standardised units are used for illustrative purposes in order to present several measures on a common basis and may not indicate probabilities due to non-normal distributions in the data. Points to the right of the axis indicate a greater degree of spare capacity than average over the period 2002 to 2007, while points to the left of the axis indicate lower than average spare capacity.
Asterisk (*) denotes the variable has been inverted to give a measure of spare capacity.
Download this image Figure 3: Indicators of spare capacity
.png (17.7 kB) .xlsx (13.5 kB)
Notes for: The labour market edges towards full capacity
- On wages, see the section “ A pick-up in consumer price inflation erodes growth in wages” and for further discussion, see Saunders, M “The Labour Market”, Speech given to Resolution Foundation, 13 January 2017.
4. A pick-up in consumer price inflation erodes growth in wages
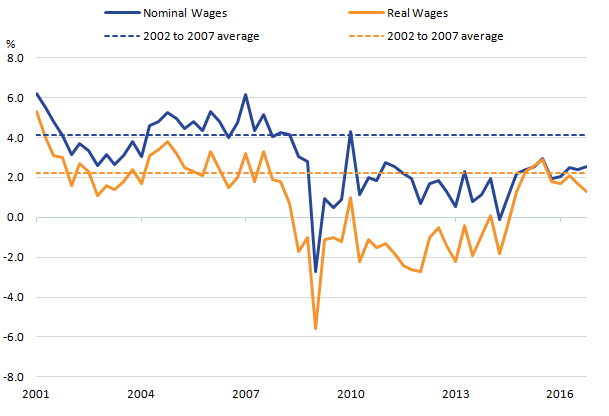
Average weekly earnings for employees increased by 2.6%, both including and excluding bonuses, compared with a year earlier. The rate excluding bonuses is the highest since the 3 months to June 2015 but well below the pre-crisis average of 3.8% experienced between 2002 and 2007 (see Figure 4).
However, taking into account the recent pick-up in the pace of consumer price inflation, real average weekly earnings increased by 1.4%, both including and excluding bonuses, over the year, the weakest pace of growth since the 3 months to December 2014.
Figure 4: Annual growth in regular average weekly earnings, real and nominal
UK, seasonally adjusted, Quarter 1 (Jan to Mar) 2001 to Quarter 4 (Oct to Dec) 2016