
Cynnwys
- Main points
- Things you need to know about this release
- Households’ saving ratio fell to a record low of 4.9% in 2017
- Real household disposable income growth slowed to 0.1% in the latest quarter
- Households accumulated more loans debt than they did financial assets for the first time in 2017
- What has happened to the net lending or borrowing positions of UK sectors?
- Summary of revisions
- National accounts articles
- Links to related statistics
- Links to related analysis
- Changes to this bulletin
- Upcoming changes to this bulletin
- Quality and methodology
1. Main points
The households’ saving ratio fell to an annual record low of 4.9% in 2017 (since comparable records began in 1963) as growth in households’ spending exceeded the growth of households’ income.
Latest estimates suggest households were net borrowers in 2017 for the first time since records began in 1987; this reflects five consecutive quarters of net borrowing by households.
Real household disposable income growth slowed to 0.1% in Quarter 4 (Oct to Dec) 2017 compared with the previous quarter, as the impact of inflation on income intensified.
Households accumulated slightly more debt (loans) in 2017 than they did financial assets for the first time since records began in 1987.
2. Things you need to know about this release
National Statistics status
On 20 March 2018, the UK Statistics Authority published a letter confirming the designation of quarterly sector accounts statistics as National Statistics. National Statistics means that official statistics meet the highest standards of trustworthiness, quality and value. The letter praised the richer analysis on the households sector and the improvements in communicating technical concepts to a less technical audience. We are keen to continue this type of analysis and we welcome feedback and suggestions for additional content for the bulletin or supplementary pieces.
We also maintain an email subscription list informing interested people when there are planned changes to the bulletin. If you wish to subscribe to this list, please email us at sector.accounts@ons.gov.uk with “subscribe” as the subject line.
Understanding the sector and financial accounts
This bulletin presents UK aggregate data for the main economic indicators and summary estimates from the institutional sectors of the UK economy: private non-financial corporations, public corporations, financial corporations, central and local government, households, non-profit institutions serving households (NPISH) and the rest of the world sector, that are presented in the UK Economic Accounts (UKEA) dataset.
In September 2017, the households and NPISH sectors were published separately for the first time. Previously they were published as a combined sector. Indicators such as the households’ saving ratio and real household disposable income now come from the households-only sector.
This bulletin uses data from the UKEA. The UKEA provides detailed estimates of national product, income and expenditure, UK Sector Non-financial and Financial Accounts and UK Balance of Payments. These accounts are the underlying data that produce a single estimate of gross domestic product (GDP) using income, production and expenditure data.
Comparability
Data in this bulletin are internationally comparable. The UK National Accounts are compiled in accordance with the European System of Accounts: ESA 2010, under EU law and in common with all other members of the European Statistical System. ESA 2010 is itself consistent with the standards set out in the United Nations System of National Accounts 2008: SNA 2008.
An explanation of the sectors and transactions described in this bulletin can be found in chapter 2 of the European System of Accounts 2010: ESA 2010 manual.
Estimates within this release
This bulletin includes new data for the latest available quarter, Quarter 4 (Oct to Dec) 2017 and revisions to data from 2017.
This bulletin follows the National Accounts Revisions Policy.
All data within this bulletin are estimated in current prices (also called nominal prices), except for real household disposable income, which is estimated in chained volume terms.
Current price series are expressed in terms of the prices during the time period being estimated. These describe the prices recorded at the time of production or consumption and include the effect of price inflation over time. Chained volume series (also known as real terms) have had the effects of inflation removed.
All figures given in this bulletin are adjusted for seasonality, unless otherwise stated. Seasonal adjustment removes seasonal or calendar effects from data to enable more meaningful comparisons over time.
The Population estimates for UK, England and Wales, Scotland and Northern Ireland used in this release are those published on 22 June 2017 and the population projections used are those published on 26 October 2017.
Real household disposable income (RHDI) explained
Household income is measured in two ways: in current prices (also called nominal prices) and in real terms, where the effect of price inflation is removed.
Gross disposable household income (GDHI) is the estimate of the total amount of income that households have available; that is, from wages received, income of the self-employed, social benefits, pensions and net property income (earnings from interest on savings and dividends from shares) less taxes on income and wealth. These are given in current prices. Gross disposable income tells us how much income households had to spend, save or invest in the time period being measured once taxes on income and wealth had been paid.
Adjusting GDHI to remove the effects of inflation gives another measure of disposable income called real household disposable income (RHDI). This is a measure of the real purchasing power of households’ income, in terms of the physical quantity of goods and services they would be able to purchase if prices remained constant over time. Further information on this calculation can be found in our Quality and Methodology Information.
The households’ saving ratio explained
The saving ratio estimates the amount of money households have available to save (gross saving) as a percentage of their gross disposable income.
Gross saving is the difference between households’ total available resources (mainly wages received, income of the self-employed, social benefits and net income such as interest on savings and dividends from shares, but deducting taxes on income and wealth) and household consumption (expenditure on goods and services for consumption).
The saving ratio can be volatile and is sensitive to even relatively small movements in its components, particularly on a quarterly basis. This is because gross saving is a relatively small difference between two large numbers. It is therefore often revised at successive publications when there are revisions to data. The households’ saving ratio is seen as an indicator of household financial conditions. A low saving ratio may imply that households are taking on more debt and acquiring fewer financial assets, such as pensions. Instead, household income is spent on consumption. A higher saving ratio may imply that households are acquiring more assets and taking on less debt.
Reliability
Estimates for the most recent quarters are provisional and are subject to revision in the light of updated source information. Our revisions to economic statistics page contains articles on revisions and revisions policies.
Revisions to data provide one indication of the reliability of main indicators. Revisions triangles were published for the households and non-profit institutions serving households saving ratio. However, following the separation of the households and NPISH sectors in September 2017, we have ceased production of the revision triangles for the households and NPISH saving ratio. In due course, we will reintroduce the revision triangle for the households-only saving ratio as and when meaningful analysis on revisions can be done.
Nôl i'r tabl cynnwys3. Households’ saving ratio fell to a record low of 4.9% in 2017
The saving ratio remained unchanged in the latest quarter at 5.2% compared with the previous quarter. As a result, the saving ratio in 2017 was the lowest since records began in 1963, at 4.9% as shown in Figure 1.
Figure 1: Households‘ saving ratio, seasonally adjusted
1963 to 2017, UK
Source: Office for National Statistics
Notes:
- Saving ratio calculated as gross saving divided by total available resources.
Download this chart Figure 1: Households‘ saving ratio, seasonally adjusted
Image .csv .xlsThe fall in the saving ratio in 2017 was mainly due to household spending rising at a faster pace than income, as was the case in the previous year when the saving ratio also fell. Figure 2 shows how, in 2017, households’ expenditure rose by £46.7 billion and contributed negatively to the saving ratio, while gross disposable household income (GDHI) increased by only £29.3 billion.
GDHI growth was boosted by the largest increase in wages and salaries since 2007 (£28.7 billion) as the amount of people in work reached record highs. However, this growth was partially dampened as outgoings on taxes on income and wealth also reached their highest year-on-year increase (£11.3 billion) since the same year, 2007. The rise in household expenditure was driven mainly by expenditure on housing (£10.5 billion) and spending on restaurants and hotels (£6.2 billion). Compared with the previous year, household expenditure rose by 3.8% in 2017 while GDHI increased by 2.3%.
A fall of £8.5 billion in the adjustment for pension entitlements, which represents deferred savings related to pensions, further contributed to the fall in the saving ratio in 2017.
As a result, gross savings (a measure that indicates the amount households have available to save or invest) fell by £25.9 billion year-on-year.
Figure 2: Contributions to the households' saving ratio, year-on-year, seasonally adjusted
1989 to 2017, UK

Source: Office for National Statistics
Notes:
- Saving ratio calculated as gross saving divided by total available resources.
- Gross saving calculated as total available resources minus households' final consumption expenditure.
- Total available resources calculated as gross disposable income plus adjustment to pension entitlements.
- Saving ratio (%) refers to the axis on the right-hand side (RHS). All others refer to the left-hand side axis.
Download this image Figure 2: Contributions to the households' saving ratio, year-on-year, seasonally adjusted
.png (31.6 kB) .xls (41.0 kB)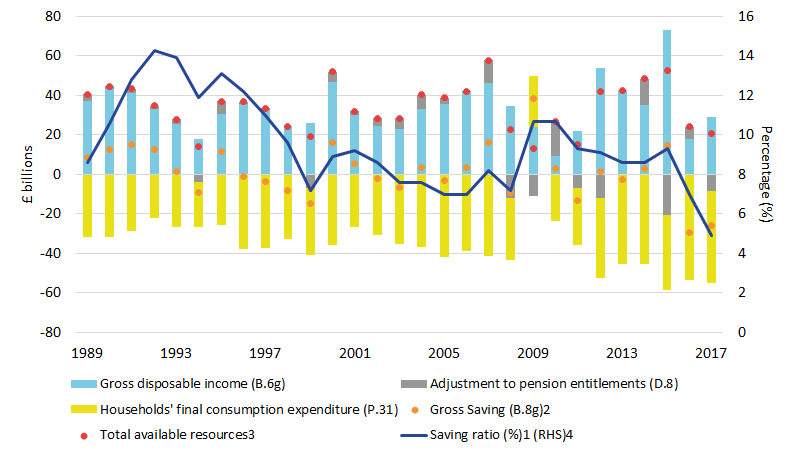
In Quarter 1 (Jan to Mar) 2017, the quarterly saving ratio fell to the lowest on record because of a larger than usual increase in taxes paid on self-reported income. Over the year, this particular effect appears to have been offset, quarter on previous quarter, as the saving ratio bounced back to above 5% and stabilised. However, compared with the same quarter a year ago, the larger than usual rise in taxes paid on self-reported income was significant as it was the main contributor to the largest year-on-year increase in taxes on income and wealth in a decade.
Nôl i'r tabl cynnwys4. Real household disposable income growth slowed to 0.1% in the latest quarter
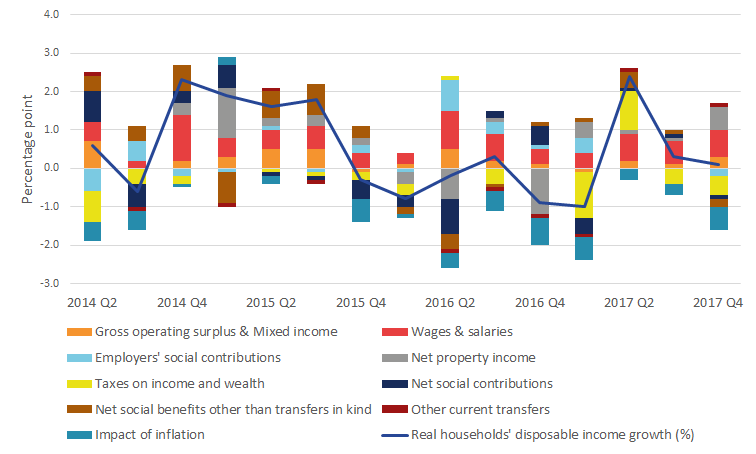
Growth in real household disposable income (RHDI) slowed for a second consecutive quarter in Quarter 4 (Oct to Dec) 2017 to 0.1%, as the impact of inflation on income further intensified.
As Figure 3 shows, wages and salaries contributed 0.7 percentage points to RHDI growth of 0.1%, quarter on previous quarter, following an increase of £2.3 billion. However, its contribution was almost completely offset by the impact of inflation (measured using the household expenditure implied deflator), which had a 0.6 percentage points contribution in the opposite direction.
An increase of £1.6 billion in taxes on income also contributed negatively to RHDI growth, at a magnitude of 0.5 percentage points. This was offset by growth of £1.8 billion in net property income (driven by dividend income from corporations and income payable on pension entitlements), which contributed 0.6 percentage points to RHDI growth.
In summary, gross disposable household income (GDHI) grew 0.7% and it was partially offset by a 0.6% increase in the household expenditure implied deflator in the latest quarter compared with the previous quarter.
Figure 3: Percentage point contributions to real household disposable income growth, quarter-on-previous-quarter
Quarter 2 (Apr to June) 2014 to Quarter 4 (Oct to Dec) 2017, UK
Source: Office for National Statistics
Notes:
- Sum of contributions to real household disposable income may not add to growth rate due to rounding.
Download this image Figure 3: Percentage point contributions to real household disposable income growth, quarter-on-previous-quarter
.png (29.1 kB) .xls (38.4 kB)
While the impact of inflation intensified quarter on previous quarter, it weakened when comparing the latest quarter with the same quarter a year ago.
RHDI grew 1.7% in Quarter 4 2017 compared with Quarter 4 2016. This is the fastest such growth since Quarter 1 (Jan to Mar) 2016 when it grew 2.4%.
Driving this quarter on same quarter a year ago increase was GDHI rising by 3.5% (its fastest rate since Quarter 4 2015) and the impact of inflation being at its lowest since Quarter 4 2016 at 1.8%.
The first estimates for 2017 suggest that RHDI grew 0.3% year-on-year compared with no growth in 2016. The 2017 increase in RHDI was a result of a 2.0% increase in the household expenditure implied deflator offsetting much of the 2.3% growth in GDHI.
One of the main contributors to GDHI growth in 2017 was total wages and salaries, which grew by £28.7 billion. This was the highest year-on-year increase in a decade, as the amount of people in work increased.
Currently, the period open to revisions affects only Quarter 1 2017 to Quarter 3 (July to Sept) 2017. Revisions to real household disposable income were very small. In each of the three quarters open to revision, the growth rates of RHDI (latest quarter on previous quarter) were revised up by 0.1 percentage points. These revisions were mainly down to small downward revisions to the households’ expenditure deflator.
Nôl i'r tabl cynnwys5. Households accumulated more loans debt than they did financial assets for the first time in 2017
The accumulation of debt (measured by the amount of short-term and long-term loans households took out) in 2017 outstripped the amount of total financial assets they accumulated in the same period. This was the first time this happened since records began in 1987, as shown in Figure 4.
The fall in the accumulation of financial assets is due mainly to households depositing much less into UK monetary financial institutions (such as banks). In 2017, households deposited only £36.5 billion. This was the lowest since 2011, following the largest amount deposited in a single year by households in 2016 when it was £70.4 billion.
Amounts deposited into UK banks began declining from Quarter 3 (July to Sept) 2016 and remained low throughout 2017. This may reflect the fall in the return on savings as the Bank of England dropped the base interest rate to a record low of 0.25% in August 2016.
Another reason that could explain this sudden drop in deposits was the growing expectation of an interest rate rise. As inflation intensified in 2017, there was much talk of the Bank of England increasing the base rate for the first time in a decade. This expectation may have led many households to borrow and spend now while the cost of borrowing remained low, and put off saving until a (near) future date when interest rates and the return on savings increase.
Figure 4: Households‘ accumulation of debt (loans) and financial assets
1987 to 2017, UK
Source: Office for National Statistics
Download this chart Figure 4: Households‘ accumulation of debt (loans) and financial assets
Image .csv .xlsIn our previous Quarterly sector accounts bulletin, we highlighted the composition of the type of loans households were taking out. In Quarter 4 (Oct to Dec) 2017, households have continued to accumulate more loans secured on dwellings (that is, mortgages) than unsecured loans (for example, credit card loans). In annual terms, the accumulation of unsecured loans and secured loans were similar between 2010 and 2015. Despite the rise in unsecured loans, the accumulation of loans secured on dwellings has begun increasing at a faster rate than unsecured loans in the last couple of years, as was the case before 2009.
Households’ debt to income ratio
Similarly, households’ stock of financial debt (as loans) rose faster than gross disposable household income in 2017. As a result, the households’ debt to income ratio rose from 1.31 in 2016 to 1.33 in 2017 as seen in Figure 5. This was the highest households’ debt to income ratio since 2012 when it was 1.34.
Figure 5: Households‘ debt to income ratio
1987 to 2017, UK
Source: Office for National Statistics
Download this chart Figure 5: Households‘ debt to income ratio
Image .csv .xlsOn a quarterly basis, the households’ debt to income ratio remained unchanged for a third consecutive quarter at 1.33.
Nôl i'r tabl cynnwys6. What has happened to the net lending or borrowing positions of UK sectors?
The net lending or borrowing of a sector represents the net resources that the sector makes available to the rest of the economy.
The position is determined by saving, the balance between national gross disposable income and final consumption expenditure, and is reduced or increased by the balance of capital transfers to provide an amount available for financing investment. The final net lending or borrowing position then reflects total investment in non-financial assets.
If actual investment is lower than the amount available for investment, the balance will be positive – representing net lending. Similarly, if actual investment is higher than the amount available for investment, borrowing is represented.
The only UK sectors in a net lending position in Quarter 4 (Oct to Dec) 2017 were the private non-financial corporations and non-profit institutions serving households sectors. All other UK sectors are currently net borrowers in the non-financial account.
Figure 6 summarises the net lending (positive) or borrowing (negative) positions of UK sectors and the rest of the world, according to the non-financial account, as a percentage of UK gross domestic product. Following Figure 6 is further analysis on each sector’s position.
Figure 6: Net lending (positive) or borrowing (negative) positions of UK sectors and the rest of the world in the non-financial account as a percentage of UK gross domestic product
1987 to 2017, UK
Source: Office for National Statistics
Notes:
- NPISH - non-profit institutions serving households.
Download this chart Figure 6: Net lending (positive) or borrowing (negative) positions of UK sectors and the rest of the world in the non-financial account as a percentage of UK gross domestic product
Image .csv .xlsNon-financial corporations
Non-financial corporations are made up to two sub-sectors: private non-financial corporations (PNFCs) and public corporations.
PNFCs just about maintained their net lending position in Quarter 4 2017. Their position fell from (positive) £0.5 billion in Quarter 3 (July to Sept) 2017 to (positive) £0.1 billion in the latest quarter. This decrease was due mainly to dividends received falling by £3.3 billion quarter on previous quarter. Despite being net lenders in the last two quarters of 2017, PNFCs were net borrowers in 2017 at (negative) £1.8 billion. As a percentage of gross domestic product (GDP), their borrowing was 0.1% in 2017.
Public corporations’ net borrowing increased in 2017 to 0.2% of GDP. The increase in 2017 was due mainly to a rise in net acquisition of non-produced non-financial assets and gross fixed capital formation.
Financial corporations
The net borrowing position of financial corporations increased to £8.2 billion in the latest quarter compared with £4.7 billion in Quarter 3 2017. This increase in borrowing of £3.5 billion was due mainly to an increase in the interest paid of £2.1 billion. In 2017, however, financial corporations decreased their net borrowing as a percentage of GDP from (negative) 2.1% in 2016 to (negative) 1.2%, attributed to an increase in reinvested earnings on foreign direct investment.
General government
Government net borrowing decreased for the third consecutive year in 2017 to £44.4 billion. As a percentage of GDP, general governments’ net borrowing was (negative) 2.2%. This was its smallest net borrowing position since 2002 when it was (negative) 2.0% of GDP. This movement was driven by an increase of £17.2 billion received by central government in taxes on income.
Further details on this sector can be found in Public sector finances. Note that although Public sector finances and national accounts are compiled in accordance with the European System of Accounts: ESA10 some differences remain.
Improvements will be incorporated in Blue Book 2018 on continued reconciliation work between the public sector finances statistics and the national accounts; notably the move away from a pure cash recording for Corporation Tax and its replacement with a time-adjusted cash approach, which better aligns the recording of when tax is deemed to be payable with the timing of the economic activity underlying the tax liability.
Households
Up until Quarter 3 2016, the households sector was a net lender. In the five quarters since, households have been net borrowers at an average of £3.3 billion per quarter. As a result, 2017 was the first year in which households were net borrowers – meaning that they had to borrow in order to fund their spending and investment activities. They borrowed £14.4 billion (0.7% of GDP) and much of this borrowing was down to spending (up £46.7 billion) as opposed to investment in non-financial assets (up £5.5 billion).
Households’ net lending as a percentage of gross disposable household income (also known as households’ financial saving ratio) averaged 4.8% between 1987 and 2016 before falling negative to 1.1% in 2017, reflecting their net borrowing.
A negative financial saving ratio indicates that households had to borrow from the financial account (that is, through loans) to fund their economic activity (that is, spending, saving and investing).
Compared with other advanced economies such as those in the G7 group, the UK’s financial saving ratio appears to be more in line with that of the USA and France – as shown in Figure 7. However, from Quarter 3 2016, the UK began to diverge from the two countries as it became a net borrower. Canada is the only other country where the households’ financial saving ratio is negative (negative 6.2% in the latest quarter) while Germany’s stands at around 35.0%, implying that households have a lot more available to save after spending and investment.
The main difference between the saving ratio and the financial saving ratio is that the latter includes changes in capital assets (that is, investment) and excludes pension entitlements as income.
Figure 7: International comparison of net lending (positive) and borrowing (negative) as a percentage of gross disposable household income, seasonally adjusted,
Quarter 4 (Oct to Dec) 1997 to Quarter 4 (Oct to Dec) 2017, G7 countries4
Source: Statistics Canada, Bureau of economic analysis, Statistisches Bundesamt (Destatis), Institut national de la statistique et des études économiques, Cabinet office Japan, Office for National Statistic
Notes:
- Households
- Households and non-profit institutions serving households
- All series are authors' calculations
- G7 countries not including Italy (data not accessible)
Download this chart Figure 7: International comparison of net lending (positive) and borrowing (negative) as a percentage of gross disposable household income, seasonally adjusted,
Image .csv .xlsNon-profit institutions serving households (NPISH)
Following changes in Blue Book 2017, greater analysis can now be undertaken on the non-profit institutions serving households (NPISH) sector following its separation from the households sector. Figure 6 puts into perspective the relatively small size of the NPISH sector compared with other UK sectors. However, the sector (which includes, for example, charities and universities) remains an important one because of its social benefits to society.
As shown in Figure 8, the NPISH sector was previously a longstanding net lender. It averaged a net lending position of £4.7 billion between 1987 and 2013 before it briefly became a net borrower in 2014, mainly due to spending. Figure 8 also highlights how current transfers received declined from 2011 onwards. At the same time, NPISH expenditure diminished, as their non-market output (which is equal to NPISH expenditure) decreased. This reflects their shift away from non-market outputs toward more market outputs as English universities could charge up to £9,000 in tuition fees from 2012 onwards.
Figure 8: Contributions to the net lending (positive) or borrowing (negative) position of the NPISH sector from the non-financial account, seasonally adjusted
1999 to 2017, UK
Source: Office for National Statistics
Notes:
- Other contributions include: Taxes on income and wealth (D.5u), Employers' imputed social contribution (D.612r), Other social insurance benefits (D.622u) and Acquisitions less disposals of non-produced non-financial assets (NP)
- Sum of contributions may not add up to Net contributions due to rounding
Download this chart Figure 8: Contributions to the net lending (positive) or borrowing (negative) position of the NPISH sector from the non-financial account, seasonally adjusted
Image .csv .xlsRest of the world
The net lending position of the rest of the world decreased slightly to £18.7 billion in the latest quarter, reflecting the decrease in the net borrowing position of UK sectors.
In 2017, rest of the world lending to UK sectors fell by £31.0 billion; the largest fall on record (since 1987). This drop in the rest of the world’s net lending position reflects reinvesting earnings on direct UK investment of £19.4 billion.
Further details of the UK Balance of Payments position can be found in the Balance of payments bulletin.
Nôl i'r tabl cynnwys7. Summary of revisions
Revisions in the latest quarterly sector accounts were small, but for a couple of exceptions. Most notably, the non-financial net lending or borrowing positions of private non-financial corporations were revised up in the first three quarters of 2017, due mainly to upward revisions to dividends received. Elsewhere, much of the downward revision to the non-financial net lending or borrowing position of the rest of the world was attributed to upward revisions to dividends paid.
Table 1: Summary of revisions to main economic indicators in the UK Quarterly sector accounts, Quarter 1 (Jan to Mar) 2017 to Quarter 3 (July to Sep) 2017
| Quarter 1 (Jan to Mar) 2017 to Quarter 3 (July to Sep) 2017 | |||||||||
|---|---|---|---|---|---|---|---|---|---|
| Revisions to Net lending (+) borrowing (-) positions of UK sectors, £ billions | |||||||||
| Non-financial account (B.9n) | |||||||||
| Non- financial corporations | Financial corporations | General government | Households | NPISH1 | Rest of the world | ||||
| 2017 Q1 | 3.1 | -1.1 | 0.5 | 0 | -0.1 | -1.9 | |||
| 2017 Q2 | 2.1 | -0.6 | -0.8 | -0.1 | -0.6 | -0.2 | |||
| 2017 Q3 | 1.9 | 1.3 | -0.9 | 0.3 | -0.3 | -3.5 | |||
| Revisions to Net lending (+) borrowing (-) positions of UK sectors, £ billions | |||||||||
| Financial account (B.9f) | |||||||||
| Non- financial corporations | Financial corporations | General government | Households | NPISH1 | Rest of the world | ||||
| 2017 Q1 | 17.8 | -6.3 | -0.2 | -3.1 | -1.9 | -6.4 | |||
| 2017 Q2 | -3.8 | 5.1 | -0.1 | 6.2 | -0.9 | -6.4 | |||
| 2017 Q3 | 20.9 | -12.5 | -0.9 | 0.4 | -2.6 | -5.3 | |||
| Revisions to other key economic indicators | |||||||||
| Households sector | |||||||||
| RHDI2 growth rate (quarter on previous quarter, %) | Saving ratio (%) | HHFCE3 Deflator (index points) | |||||||
| 2017 Q1 | 0.1 | 0 | -0.1 | ||||||
| 2017 Q2 | 0.1 | -0.1 | -0.1 | ||||||
| 2017 Q3 | 0.1 | 0 | -0.2 | ||||||
| Source: Office for National Statistics | |||||||||
| Notes | |||||||||
| 1. Non-profit institutions serving households | |||||||||
| 2. Real households' disposable income | |||||||||
| 3. Households' final consumption expenditure deflator | |||||||||
Download this table Table 1: Summary of revisions to main economic indicators in the UK Quarterly sector accounts, Quarter 1 (Jan to Mar) 2017 to Quarter 3 (July to Sep) 2017
.xls (39.4 kB)8. National accounts articles
We have published an article detailing the scope of the UK National Accounts Blue Book 2018 publication. Further articles discussing the methodological changes and impacts will be published and available from the National accounts articles web page.
Nôl i'r tabl cynnwys11. Changes to this bulletin
Changes to Quarterly sector accounts datasets
Further to improvements made last quarter to the quarterly sector accounts data tables, we have included the net lending or net borrowing positions as a percentage of gross domestic product (GDP) in the B.9N table in response to user feedback. If you have any suggestions please contact us by email at sector.accounts@ons.gov.uk.
We also maintain an email subscription list informing interested people when there are planned changes to the bulletin. If you wish to subscribe to this list, please email us with “subscribe” as the subject line.
Withdrawal of UKEA pdf
As previously announced, we have withdrawn the PDF version of the UK Economic Accounts (UKEA). Following user feedback, we now publish a full Excel version of the UKEA alongside the separate files by sector.
Nôl i'r tabl cynnwys12. Upcoming changes to this bulletin
English Housing Associations
Following passage of The Regulation of Social Housing (Influence of Local Authorities) (England) Regulations 2017, we have completed an assessment of the housing associations sector in England. The review has been completed in the context of international rules laid out in the European System of Accounts 2010 and the accompanying Manual on Government Deficit and Debt 2016.
We have concluded that registered providers of social housing in England are private, market producers and as such they will be reclassified to the private non-financial corporations sub-sector for the purpose of national accounts and other economic statistics. This classification takes effect from 16 November 2017, the date the regulations came into force, and will be implemented in the next release of UK Quarterly national accounts to be published in June 2018.
Nôl i'r tabl cynnwys13. Quality and methodology
The Quarterly sector accounts Quality and Methodology Information report contains important information on:
the strengths and limitations of the data and how it compares with related data
uses and users of the data
how the output was created
the quality of the output including the accuracy of the data
The Quarterly sector accounts and the UK Economic Accounts are published at quarterly, pre-announced intervals alongside the Quarterly national accounts and Quarterly balance of payments statistical bulletins.
Nôl i'r tabl cynnwysManylion cyswllt ar gyfer y Bwletin ystadegol
Related publications
- Monthly economic commentary: March 2018
- Index of Services, UK: January 2018
- Consumer trends, UK: October to December 2017
- Business investment in the UK: October to December 2017 revised results
- GDP quarterly national accounts, UK: October to December 2017
- Balance of payments, UK: Quarter 4 (Oct to Dec) 2017