
1. Summary
This article introduces the three main changes to the national balance sheet (NBS) for Blue Book 2017.
The first change is the introduction of a method to split estimates for the value of land from previously published estimates of the combined values of land and assets. This will become a mandatory transmission to Eurostat by the end of 2017 for the institutional sector grouping households (S.14) plus non-profit institutions serving households (NPISH; S.15). The method allows the compilation of land estimates for other sectors to provide a consistent measure of the UK net worth on the non-financial balance sheet and is consistent with the Eurostat and Organisation for Economic Co-operation and Development (OECD) compilation guide on the estimation of land.
This method produces estimates of the two types of land that are deemed to have the greatest value in the UK: land underlying buildings and structures, and land underlying cultivated biological resources. Estimates of the other two types of land (recreational land and other land not elsewhere classified) are not currently possible due to a lack of available data. The methodological changes used in the introduction of the split for the asset land increases total UK net worth by 1% on average between 1995 and 2015.
The second change is that as part of the European System of Accounts 2010 (ESA 2010), there is a requirement to split the S.14 households (HH) and S.15 non-profit institutions serving households (NPISH) for the annual and quarterly national accounts. Users will therefore be presented with an additional two tables for HH and NPISH split separately. The changes presented in this article relate to non-financial assets owned by the HH and NPISH sectors.
Finally, the House Price Index (HPI), published in June 2016, replaced the existing price indices published separately by Office for National Statistics (ONS) and Land Registry for England and Wales. It introduced improved methodology to address limitations with the previously published house price indices.
The HPI is used as an input to estimate the value of dwellings on the non-financial balance sheet. There will be an impact on the total value of land contributed from land under dwellings. Overall, as the result of this change, the UK total net worth is on average 3 percent higher between 1995 and 2015.
Table 1 provides a summary of each of the changes to the NBS as a result of the methods changes introduced in this article.
Table 1: Summary of changes to national balance sheet
| Change | Asset affected | Old data source | New data source | Result at total economy level | ||||||||
|---|---|---|---|---|---|---|---|---|---|---|---|---|
| Land | Dwellings | Admin data | NBS, Capital stock | Changes made to the NBS to calculate land means that total net worth is around 1% higher | ||||||||
| Other buildings and structures | ||||||||||||
| Agricultural | DEFRA | DEFRA | ||||||||||
| Forestry | Forestry Commission | Forestry Commission | ||||||||||
| HH/NPISH | All | No effect on total values | ||||||||||
| HPI | Dwellings | On average 3% higher using new HPI | ||||||||||
| Source: Office for National Statistics | ||||||||||||
Download this table Table 1: Summary of changes to national balance sheet
.xls (27.6 kB)2. Introduction
With each UK National Accounts Blue Book, revisions caused by new data, methodological changes or new data sources to reflect international requirements are implemented as part of our commitment to produce accurate and reliable statistics. The national balance sheet (NBS) is an annual bulletin that provides estimates of the market value of financial and non-financial assets in the UK for the period 1995 to 2015. The NBS is a measure of the wealth, or total net worth, of the UK.
This article highlights the changes being implemented in the NBS for Blue Book 2017 onwards. Methods for each change will be discussed, as well as the impact it has on the NBS.
Firstly, to meet the European System of Accounts 2010 (ESA 2010) transmission programme, Office for National Statistics (ONS) will separately present the value of the asset “land” on the non-financial balance sheet. The methods used to estimate land underlying assets will be discussed and the impact this has on the value of the assets from which land is being estimated.
Secondly, as part of the ESA 10 requirements, Households (S.14) and Non-Profit Institutions Serving Households (NPISH) (S.15) sectors will be split across the sequence of accounts within the Blue Book and Quarterly National Accounts. An additional two tables for HH and NPISH, split separately, will be presented in NBS.
Lastly, the new House Price Index (HPI), which has replaced indices published separately by ONS and the Land Registry for England and Wales, will be implemented into the NBS. This will impact on the value of dwellings in the non-financial balance sheet.
Nôl i'r tabl cynnwys3. Land
3.1 Introduction
There is an increasing demand for land statistics, whether it is: land value, cover, use or ownership. Land statistics are a growing tool for policy officials to help them make more informed decisions on topics such as house building and planning. It can act as an indicator to explain changes in the macro economy. For example, the housing market played a role in the 2008 economic downturn, and source data used for the estimation of the total value of land, such as average land prices, may be a useful indicator in their own right. As land is an asset, large price variations, similar to properties, may indicate unsustainable developments and can also be an early indicator of future housing market developments, as a shortage of land and increasing prices will impact on the price of future building projects1.
Due to the lack of international estimates for the value of land and the need to understand the wealth of the households sector, a new requirement was set out by the European System of Accounts 2010 (ESA 2010) Transmission programme (ESA TP). This requires separate estimates of the value of land for the institutional sectors households and Non-Profit Institutions Serving households (NPISH) for the first time in 2017. The split of households and NPISH in the quarterly and annual national accounts, and in particular on the balance sheet is discussed in section 2 of this article; however the requirement gives rise to the need to separate the currently combined value of buildings, dwellings and land in the balance sheet.
The measurement of land is a difficult concept as it is not generally sold on the market independently, and therefore it has been introduced later than other ESA10 changes to allow countries sufficient time to develop methodologies and data sources to introduce this concept.
This led to the Organisation for Economic Co-operation and Development (OECD) and Eurostat assembling a special task force in 2013 to help assist the international community in applying best practice. This involved setting up guidelines for compiling estimates of land that are consistent with the text in the new ESA 2010 and the System of National Accounts 2008 (SNA 2008). They produced the Eurostat and OECD Compilation guide on land estimation publication in 2015. The UK played its part in the task force and was involved in the discussions and drafting of the guidance, so the guidance takes into account the physical and economic situation in the UK.
Historically, the UK has provided estimates of produced non-financial assets to Eurostat that combine (some types of) land with the produced assets that sit on the land (e.g. dwellings, other buildings and other structures). Using the methods in this article, the UK’s estimates of land that are transmitted in 2017 to Eurostat will be consistent with this Eurostat-OECD guidance, in that the land and the assets on the land will be separately identified
3.2 National Accounts concepts and definitions
This section draws from various statistical frameworks and discusses the concepts needed to introduce land as a non-produced, non-financial asset into the non-financial balance sheet.
The System of National Accounts 2008 (SNA 2008) and European System of Accounts (ESA 2010) manuals, as well as the Eurostat and Organisation for Economic Co-operation and Development (OECD) Compilation guide on land estimation are consistent in their definitions. The following extracts cover the relevant definitions:
Land is defined as the ground itself, including soil covering and associated surface water; the associated surface water includes any inland waters (reservoirs, lakes, rivers) over which economic ownership rights can be exercised and from which economic benefits can be derived by their owners2.
The enforcement of ownership rights is an important characteristic of land as an asset. The SNA 2008 and ESA 2010 distinguish ownership into legal and economic; the legal owner is the unit entitled in law to the benefits of possession. However, a legal owner can contract with another unit for the latter to accept the risks and rewards of using the entity in production, in return for an agreed payment. The nature of the agreement is a financial lease, where the payments reflect only the placing of the asset at the disposal of the borrower by the provider3. The economic owner of entities, such as goods and services, natural resources, financial assets and liabilities, is the institutional unit entitled to claim the benefits associated with the use of the entity in question in the course of an economic activity by virtue of accepting the associated risks. In this article “ownership rights” refers to economic ownership rights.
Institutional units are defined as the elementary economic decision-making centre characterised by uniformity of behaviour and decision-making autonomy in the exercise of its principal function; examples of these are financial corporations, private non-financial corporations, public corporations and households.
The value of land will be shown under natural resources in the balance sheet; this excludes the value of improvements, the value of buildings on the land and transfer costs, which are all shown separately under fixed assets.
Land will appear on the non-financial balance sheet and will be valued at its current market price; this current market price excludes the costs of ownership transfer, which are treated, by convention, as gross fixed capital formation (GFCF) and of land improvements, and are subject to consumption of fixed capital. For more information regarding the definitions, refer to Annex A.
Figure 1: Non-financial assets with a land component
UK, 2017
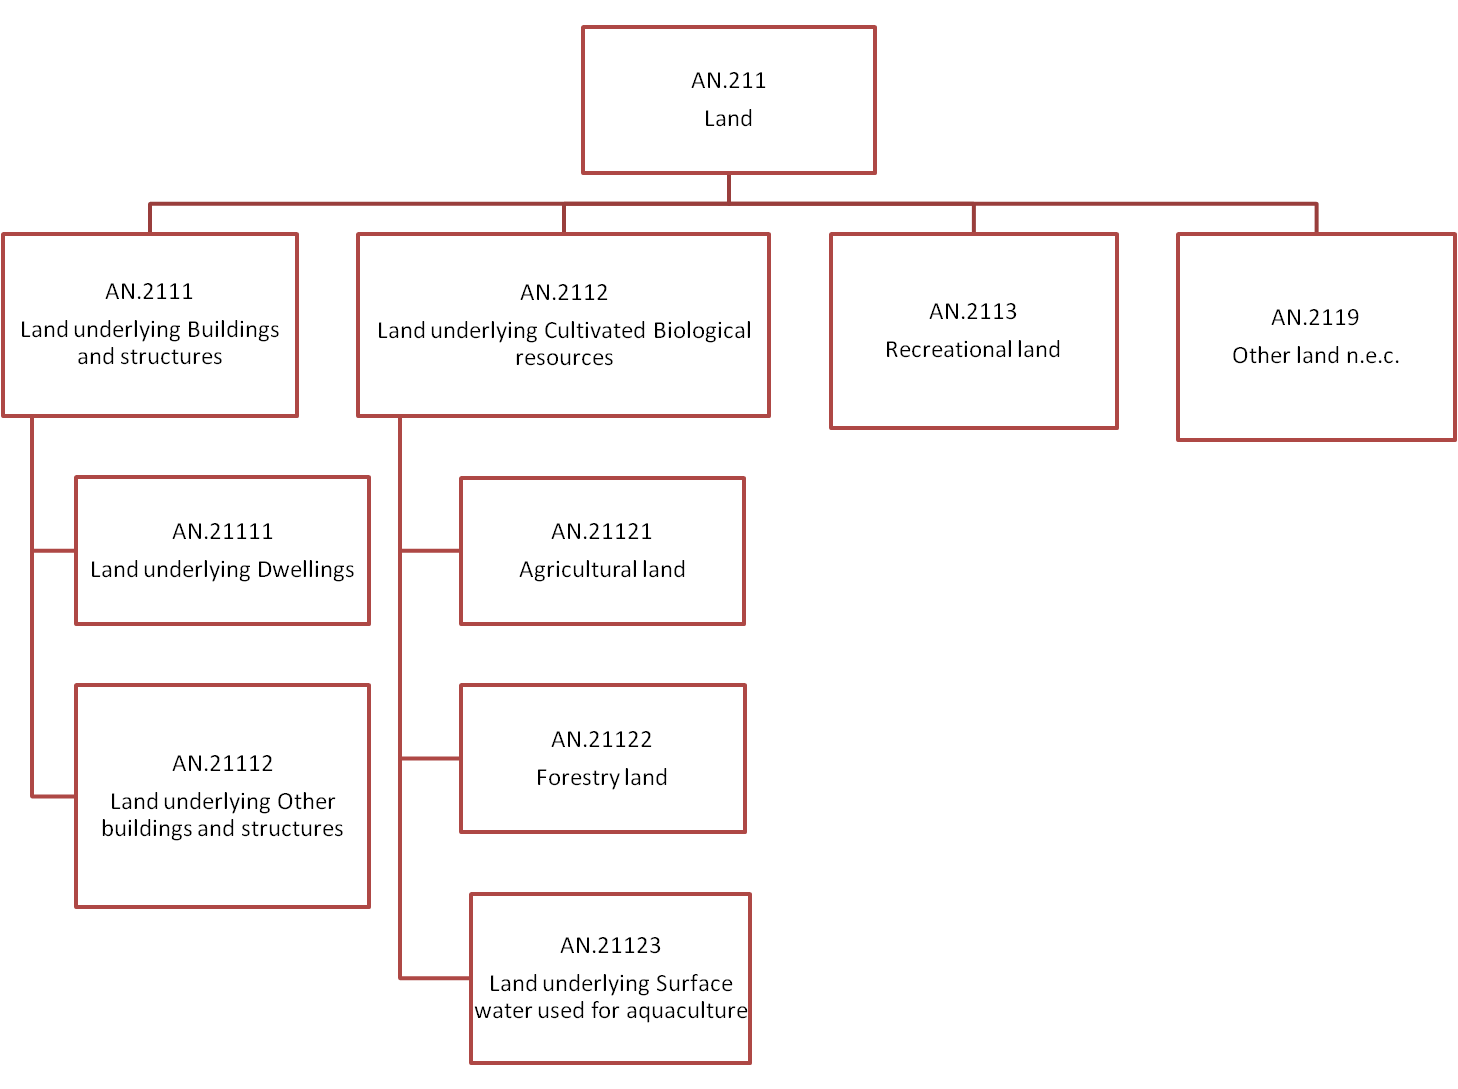
Source: Organisation for Economic Co-operation and Developmen (OECD) - Eurostat compilation guide on land estimation 2015
Notes:
- n.e.c means not elsewhere classified.
Download this image Figure 1: Non-financial assets with a land component
.png (40.3 kB) .xls (29.2 kB)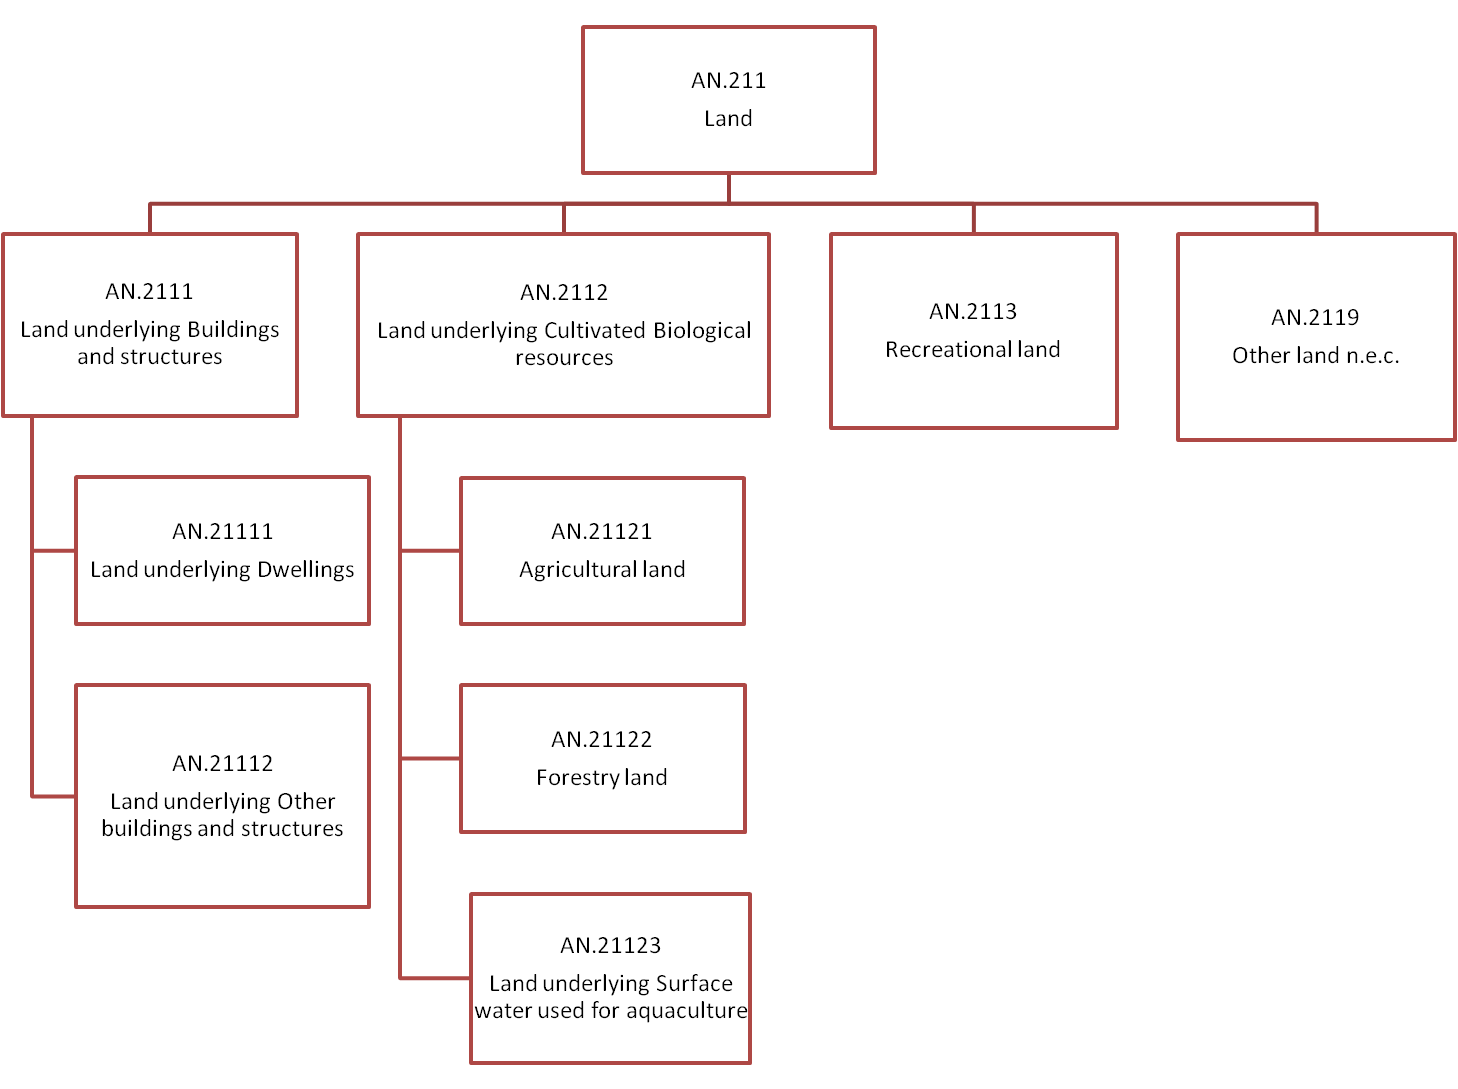
Figure 1 shows the international classification of land. This provides consistency when comparing asset codes.
Can we assume that all UK land falls within the asset boundary?
This section looks at the two main conceptual issues relating to what land should be included in the UK estimates. It looks at whether land can be defined as an asset.
The definition of land mentions the enforcement of ownership rights as an important characteristic of land as an asset4. From the definition, land can be considered as an asset if there is an institutional unit, such as a non-financial corporation, that exercises effective ownership rights over the land. We assume that all land within UK borders is owned by one of these institutional units. Even where ownership cannot be clearly identified, the general government can be considered as the economic owner of the land according to the Eurostat and OECD Compilation guide.
Another criterion mentioned in the definition of land (SNA 2008, paragraph 1.46), and in the definition of an asset in general, is the need to derive economic benefits from it. Unlike the criterion of ownership, in some cases it may be difficult to determine whether or not this criterion is fulfilled. In most cases, it is possible to derive economic benefits such as building and using a factory on it. Therefore, it is reasonable to assume that all land in the UK falls within the asset boundary.
Only land within UK economic territory should be included within estimates for the national economy. UK economic territory excludes foreign territorial enclaves such as embassies, military bases and consulates that are geographically located in the UK. Similarly, UK economic territory includes enclaves controlled by the UK, but situated geographically in the rest of the world.
If UK land is owned by a non-resident entity, for example, a foreign company, then in national accounts, an artificial unit is created. Non-financial assets in a country (S.1) are always recorded on the balance sheet of that country; units from the rest of the world (S.2) can only have financial, not non-financial claims on assets in S.1. This gives rise to the existence of notional units that the foreign units have a financial claim to. This so called “notional resident unit” is considered as being the resident owner of the land. The non-resident owns the notional resident unit, rather than owning the land directly. So there is an equity liability of the resident notional unit to the non-resident, but the land itself is always an asset of the economy in which it is located (ESA 2010, paragraph 18.5 to 18.6).
3.3 Methods
The data used to estimate the values for land should ideally possess several characteristics in order for them to be suitable for use, such as:
coverage: data should cover all UK economic territory
periodicity: should be annually on a calendar year basis
valuation basis: estimates should be valued at current market prices
sector breakdown: this is preferable if available, can be adjusted if available at total level
source: should be reputable, produced using consistent methodology and with unchanging definitions over a time series, adjusted to compensate for changes that have been made
Methods for estimating land
The following methods are set out in full in the Eurostat and Organisation for Economic Co-operation and Development (OECD) Compilation guide on land estimation, but simplified versions of the methods are reproduced here.
The direct method
The direct method estimates land on a price multiplied by quantity basis, where the total land value in time period t (LVt) can be expressed as the sum of land price per hectare for a plot (Pi,t) multiplied by the area in hectares of the plot (Xi,t) for all n observational units (i) in time period t.
This can be described by the equation:
Indirect: residual method
The value of underlying land (LVi,t) for each category of buildings and structures (sometimes referred to as construction) (i) is obtained as a residual, by subtracting the estimate of constructions, that is, the purchaser’s price of the structure, written down for the consumption of fixed capital, from the combined value of structures and land (CVi,t), in time period t, where the value of structures and land are observed at current market prices. This can be described by the following equation:
The total value of land can then be obtained by aggregating all estimates for differing structures using the following equation:
Indirect: land to structure ratio method
At its most basic, the land to structure ratio (LSR) method uses a simple identity valid at any level of aggregation, using the following equation:
Using estimates for the value of structures (SVt) and the LSR, the value of land (LVt) can be derived by reversing the previous identity, using the following equation:
Calculating land to structure ratios relies on the availability of data on the value of structures and land components for a sample of the total stock of properties within an economy. The representativeness of the sample relative to the total set of properties for which it will be used is a crucial aspect of implementing this method.
Indirect: hedonic method
The hedonic approach is built upon a regression model with a set of independent explanatory variables and a dependent variable. For example, the dependent variable could be the price of land under dwellings (LV). The independent variables that are inputs to the model would depend on available data sources, for example, the model for land under dwellings (LV) could include the number of rooms (B) or the size of the garden (L).
This can be described by the following equation:
The outputs of the model would be values for coefficients P1 and P2, which would express the value of the land in terms of the value of independent variables in the model.
The specification of the regression model is not unique as the number of independent variables could vary depending on available source data and which set of variables produces the most accurate model. Multiple models can be used for each land type and region.
Chosen method for the UK
These four methods each have advantages and disadvantages when being used to estimate different types of land. The limiting factor for the chosen method for the UK will be the data sources available for each of the land types.
We have reviewed the available data and its suitability for use with each method, which led to the following conclusions:
the hedonic approach could not be used due to the large data requirements needed to build the model and a lack of data available to meet these requirements
similarly the land to structure ratio method could not be used due to data availability. While some data was available for dwellings, the data was mainly for newly built dwellings, which are unrepresentative of the total stock of dwellings in the UK.
the method chosen to estimate the value of the asset land underlying other buildings and structures, land underlying dwellings, and forestry land was the residual method.
the direct method was chosen to estimate agricultural land
both direct and residual methods had suitable data sources covering the whole of the UK economy and will be explained in more detail in this article
3.4 Assets
As shown in Figure 1, there are a number of sub-classifications of land. This section analyses the methods considered and presents conclusions as to which method has been chosen for each asset that falls under land (AN.211).
3.4.1 Land underlying buildings and structures (AN.2111)
This asset includes both Land underlying dwellings (AN.21111) and Land underlying other buildings and structures (AN.21112).
The indirect residual method has been chosen to estimate the asset land underlying other buildings and structures and land underlying dwellings. The residual method provides consistency with observable market values of properties and the estimates of the stock of buildings from the perpetual inventory method5 (PIM) and has been successfully implemented in other countries, including Statistics Netherlands. These reasons support our decision to use this method for the UK to estimate the value of land underlying dwellings and other buildings and structures.
The national balance sheet (NBS) dataset is used to represent the combined value (NBSi, t). The combined value is the land plus the structure. Office for National Statistics (ONS) uses numerous sources to ensure that the estimates are representative of the UK’s assets. More information on how the NBS is compiled can be found in the National Balance Sheet statistical release.
The capital stock dataset is used as the structural value (CSi,t). Reliable sources for the structural value are not readily available elsewhere and the European System of Accounts (ESA 2010) states that fixed assets are recorded at market prices or, if not possible, then at purchasers’ prices plus the costs of ownership transfer at acquisition, less the accumulated consumption of fixed capital. As it is unlikely that dwellings will be sold separate from the land on which they sit, an alternative source of data is needed to represent the structural value.
Net capital stock is defined as the market value of fixed assets. Estimates of the net capital stock are estimated by ONS using the perpetual inventory method5, which takes gross fixed capital formation (GFCF) data by industry and uses it to form estimates of the value of capital stocks in use in the UK.
However, net capital stock may be not be fully representative of the holding sector due to the treatment in GFCF of the change in ownership of second hand assets. Due to the issue of separating the value of land and buildings in the GFCF data for existing construction type assets, “dwellings” and “buildings and other structures” assets are only recorded when first constructed and any disposals and acquisitions when they are used are not recorded. This means that these produced assets belong to the stock of the sector of their first investment throughout their whole service life. This may result in underestimations/ overestimations in each sector. Whilst we recognise these limitations, they are not considered to be significant enough to invalidate the use of the residual method in the absence of a viable alternative.
The residual formula applied to land underlying buildings and structures can be described by the following equation:
Improving the distribution of real estate value sector breakdown
The two datasets being used (NBS and net capital stock) have differences in their respective sectorisation methods. In order to provide consistency, the same sectorisation method should be used in both cases. The current inconsistencies between the datasets mean that negative values are possible. However, conceptually, negative values for land are not possible as an asset is equal in value to the discounted benefits of using it in production and these must necessarily be positive. We are applying the sector breakdown from the net stock estimates to the NBS data, thus eliminating the possibility of negative estimates.
Special cases
For assets, dwellings and other buildings and structures, there are some special cases that need to be considered.
These special cases include:
land owned by residents of other countries
extraterritorial enclaves
splitting the asset other buildings and structures
comparison with non-produced non-financial asset land flow series
separating land improvements from land
treatment of the asset dwellings for financial corporations
Annex B details the findings from assessing each case.
3.4.2 Land underlying cultivated biological resources (AN.2112)
Agricultural land (AN.21121)
The chosen method in the UK for agricultural land is the direct method. The direct method requires a price and quantity element, both of which are available for agricultural land. This would ideally be available at a high level of disaggregation to ensure that the prices of different land types are adequately captured. This method has already been successfully implemented for agricultural land by the Department for Environment, Food and Rural Affairs (DEFRA) in the UK and so relevant data are already available.
DEFRA’s Agriculture balance sheet includes a value for UK agricultural land. The land value is estimated using a direct method, using the price data gathered by Royal Institution of Chartered Surveyors (RICS) in the Rural Land Market Survey and area data that is gathered by an annual DEFRA survey. Their land values are produced consistently with the direct method from the Eurostat and Organisation for Economic Co-operation and Development (OECD) compilation guide. The land value is presented at a total level in the agricultural balance sheet, however, it is an aggregation of values estimated using the direct method by farm land type.
The percentages that are used to break down agricultural data into institutional sectors were sourced from capital stock data. Annual estimates of the breakdown will be applied, so that the distribution is up to date with any changes in capital stock data. An average of data between 1995 and 2014 can be found in Table 2 to show the proportional allocation that will be applied to the agricultural data.
Table 2: Percentage values of capital stock to be applied to agricultural land values
| Sector | Percentage | |
|---|---|---|
| S.1 | Total economy | 100.0 |
| S.11001 | Public corporations | 0.1 |
| S.11PR | Private-non financial corporations | 65.8 |
| S.12 | Financial corporations | 0.0 |
| S.1311 | Central government | 5.9 |
| S.1313 | Local government | 0.3 |
| S.14 | Households | 28.0 |
| S.15 | NPISH | 0.0 |
| Souce: Office for National Statistics | ||
| Notes: | ||
| 1. Figures may not add up due to rounding | ||
Download this table Table 2: Percentage values of capital stock to be applied to agricultural land values
.xls (27.1 kB)Forestry land (AN.21122)
The chosen method in the UK for forestry land is the indirect residual method. The residual method requires the total forestry value, as well as a value for the timber. In support, the method has been used by other countries, such as Finland, to estimate forestry land values.
The Forestry Commission (FC) England, Forestry Commission (FC) Scotland and Natural Resources Wales were chosen as the source of this data; due to lack of other available sources of forestry estimates, forest estate values are obtained from these departments’ annual accounts. Forest estate is a composite asset constituted by the forest land and the standing timber and is approximated using the property, plant and equipment (PPE) asset value (that is, the combined value of tangible assets such as land, buildings and vehicles).
These figures have never included any data from the Department of Agriculture, Environment and Rural Affairs (DAERA) in Northern Ireland. In the annual accounts, Northern Ireland produces a value for land and timber that will be incorporated into existing data so that the whole of the UK is represented in these estimates.
Where forestry land is owned by an institutional unit, the cultivated timber value, which is classed as an inventory held by that institutional unit, can be produced consistent with international best practice using the perpetual inventory method5 (PIM). An estimate for the value of cultivated trees in all sectors combined is estimated by Office for National Statistics (ONS); this figure was estimated using the PIM until 1998. Since 1998, the value of cultivated timber has been adjusted using the percentage that the value of FC forests has changed since the previous year.
To find the value of land, the Forestry Commission’s forest value is scaled up according to institutional sector breakdown percentages. This reflects the fact that the Forestry Commission is classed under the institutional sector; central government, which is around 22 percent of the total economy figure. Once the value of Forestry Commission forests is scaled up to represent the value of forests across the whole economy, the total value of trees can be subtracted to give the value of land underlying forests.
Forestry data will be split using the Forestry Commission’s National Inventory of Woodland and Trees – Great Britain, which provides a proportional split for all the institutional sectors in the UK. These percentages can be found in Table 3.
Table 3: Percentage values to be applied to forestry land values
| Sector | Percentage | |
|---|---|---|
| S.1 | Total economy | 100.0 |
| S.11001 | Public corporations | 2.5 |
| S.11PR | Private-non financial corporations | 12.3 |
| S.12 | Financial corporations | 0.0 |
| S.1311 | Central government | 34.7 |
| S.1313 | Local government | 3.1 |
| S.14 | Households | 43.6 |
| S.15 | NPISH | 3.8 |
| Source: Office for National Statistics | ||
| Notes: | ||
| 1. Figures may not add up due to rounding | ||
Download this table Table 3: Percentage values to be applied to forestry land values
.xls (27.1 kB)Surface water used for aquaculture (AN.21123)
This category includes land and associated surface water used as aquaculture facilities and fish farming, involving human interventions such as stocking and feeding.
Data on the value of fish produced in UK fisheries can be found in Aquaculture statistics for the UK, with a focus on England and Wales, 2012, which is produced by the Centre for Environment, Fisheries and Aquaculture Science (CEFAS).
Data could not be sourced on the area of land these fisheries occupy, nor any information on the price of aquaculture land. Therefore, it is currently not possible for a value to be calculated for this land type.
Recreational land and associated surface water (AN.2113)
This category includes land used as privately owned amenity land, parkland and pleasure grounds, as well as publically owned recreational areas and associated surface water.
In the UK there are 15 national parks, which the National Park Authorities look after, overseen by National Parks UK. National Parks UK have an estimate of the land area taken up by each national park; however, there is no information available on land values. Another issue is that national parks contain dwellings, other buildings and structures (OBS), agricultural and forestry land, as well as recreational land, so valuing this land would involve some overlap with other land types.
Currently no data has been identified to make an estimate on recreational land in national parks. There are also numerous other parks and recreational spaces in the UK, for which no source of data has been identified.
3.4.4 Other land and associated surface water not elsewhere classified (AN.2119)
This category includes land within the asset boundary that cannot be classified elsewhere. It also includes surface waters not captured by the other categories such as rivers. Currently no data has been identified for land in this category.
3.4.5 Summary
The changes being made for each asset can be summarised as follows in Table 4.
Table 4: Summary of changes for land
| Asset | Method | Data sources | |
|---|---|---|---|
| AN.21111 | Dwellings | Residual | NBS, Capital stock |
| AN.21112 | Other buildings and structures | Residual | |
| AN.21121 | Agricultural | Direct | DEFRA |
| AN.21122 | Forestry | Residual | Forestry Commission |
| Source: Office for National Statistics | |||
Download this table Table 4: Summary of changes for land
.xls (18.4 kB)3.5 Results
The asset land (AN.211) will be (except in the case of agricultural land) derived as a residual from produced non-financial assets (dwellings, other buildings and structures, and cultivated biological assets); therefore, the value of the non-financial balance sheet as a whole, at top sector level (S.1) will be mostly unchanged.
On average, the changes being made to the data will increase the total net worth by 1% over the entire time series, as shown in Figure 2 (for more information on the changes, please see section 3.4 and Annex B).
Figure 2: Impact on total net worth after introducing the asset land (AN.211)
UK, 1995 to 2015
Source: Office for National Statistics
Download this chart Figure 2: Impact on total net worth after introducing the asset land (AN.211)
Image .csv .xlsThe combined value figure for dwellings will remain the same as in previous years, however, an adjustment made in other buildings and structures (AN.112) will change the combined value figure for this asset. More details on this adjustment can be found in Annex B.
This section highlights the results and impact on each asset.
3.5.1 Land underlying buildings and structures (AN.2111)
Land underlying dwellings (AN.21111)
Following the split of land value from the combined value, net capital stock data will be used for the structural values in the produced part of the non-financial balance sheet. The net capital stock series will not be affected by the change in methodology.
Figure 3 shows the impact of splitting the asset land from dwellings in the national balance sheet (NBS) based on the Blue Book 2016 results.
Figure 3: Impact on dwellings by introducing the asset land (AN.211)
UK, 1995 to 2015
Source: Office for National Statistics
Download this chart Figure 3: Impact on dwellings by introducing the asset land (AN.211)
Image .csv .xlsFor dwellings, the old total economy estimates (S.1) are equal to the new total economy estimates (S.1) as it comprises 100% of the sectors in both the NBS and capital stocks, and no changes have been made to the top level figure.
In 1995, both land and structure were roughly similar proportions of the value of the combined value, with land accounting for 55% and the structure accounting for 45%.
Over the time period, the proportion of the value of land to the combined value has increased from 55% (£655 billion) in 1995 to 68% (£3,730 billion) in 2015. The fact that the proportion of the value of land is greater than the structure, suggests that factors associated with land, such as location, increase the value added to the property more than the actual structure of the dwelling.
Although, the market value of structures has also increased from £543 billion to £1746 billion, the proportional value has decreased from 45 percent in 1995 to 32 percent in 2015. Table 5 provides more detail on the effects on sector level data.
Land underlying other buildings and structures (AN.21112)
Figure 4 shows the impact of splitting the asset land from other buildings and structures in the national balance sheet (NBS), based on the Blue Book 2016 results.
Figure 4: Impact on other buildings and structures (OBS) by introducing the asset land
UK, 1995 to 2015
Source: Office for National Statistics
Download this chart Figure 4: Impact on other buildings and structures (OBS) by introducing the asset land
Image .csv .xlsFor other buildings and structures (OBS), the old total economy (S.1) is not equal to the new total economy estimates (S.1) due to changes made to the OBS input data. These changes have been made to improve the valuations of estimates of OBS and more information about the changes can be found in Annex B.
In contrast to dwellings, the proportion of land to the value of the combined value decreases over the time period from 35 percent in 1995 to 26 percent in 2015. The proportion of the structural value to new combined value was 65 percent in 1995 and increased to 74 percent in 2015. This could be due to the fact that these structures, including factories, bridges, and shops, are specialised and have a specific purpose which has more influence on their value over where they are located.
Table 5 provides more detail on the effects on sector level data.
3.5.2 Land under cultivation (AN.2112)
Agricultural land (AN.21121)
Office for National Statistics (ONS) publishes a figure in the national balance sheet (NBS) for the non-financial asset of “cultivated biological resources”, which includes the land underlying them. One of the inputs to this is the value of fixed agricultural assets which is sent to ONS by the Department for Environment, Food and Rural Affairs (DEFRA). This data includes a value for land including the business use of dwellings on the agricultural land. A separate value for the business use of dwellings on agricultural land is also received. The land value can be estimated by subtracting one from the other.
The results from this data can be compared with the data taken from DEFRA’s aggregate balance sheet for the UK agricultural industry.
Figure 5: Comparison of agricultural land values, current compared with proposed
UK, 1995 to 2014
Source: Department for Environment, Food and Rural Affairs, Office for National Statistics
Notes:
- Department for Environment, Food and Rural Affairs land value data is taken from the aggregate balance sheet for the UK agricultural industry.
- Office for National Statistics land value data is taken from the national balance sheet input data for cultivated biological resources.
- Data only currently available to 2014 from source.
Download this chart Figure 5: Comparison of agricultural land values, current compared with proposed
Image .csv .xlsFigure 5 shows the comparison of agricultural land values from DEFRA and from the NBS. We can see that both trend lines are very similar in their direction and pattern. The differences between the two figures are likely to have come from variations in the estimate of the business use of dwellings. Looking at both data sources, the similarities between the two will mean that changing from one to the other will not have a significant impact on the value of land at the total economy level.
Table 5 provides more detail on the effects on sector level data.
Forestry land (AN.21122)
As mentioned previously, ONS publishes a figure in the national balance sheet (NBS) for the produced non-financial asset of “cultivated biological resources”, which includes the non-produced non-financial asset land underlying it. One of the inputs into this is the value of forestry, which is sent to ONS by the Forestry Commission (FC). The value of FC owned forests can be scaled up to represent total forests and the value of trees can then be deducted. The results from this calculation can be seen in Figure 6 compared with the old estimates of land under forestry.
Figure 6: Comparison of forestry land values, current compared with proposed
UK, 1995 to 2015
Source: Forestry Commission, Office for National Statistics
Download this chart Figure 6: Comparison of forestry land values, current compared with proposed
Image .csv .xlsFigure 6 illustrates that our change in method improves the negative values of forestry land from 2009 onwards. These negative values for land are not possible since land cannot be owed, but have been estimated due to inconsistencies in the old method. These negative values have not been published explicitly in the balance sheet previously as they are currently a component of a higher level aggregate.
Table 5 provides more detail on the effects on sector level data.
3.5.3 Sectors
Table 5 summarises all the results for each asset explained in this article by sector, highlighting the differences with the previous methods.
Table 5: Summary of all results by asset and sector
| Sector | Dwellings | Other Buildings and Structures (OBS) | Agriculture | Forestry | ||||
|---|---|---|---|---|---|---|---|---|
| S.1 | New combined value is the same value as old combined value | New combined value is on average 6% higher than old combined value after changes | Value on average 13% lower than previous. Trend is similar | Value now positive for all years | ||||
| Total economy | ||||||||
| S.11001 | New combined value is 400% higher than the old combined value in 2015 and is at least 100% higher since 2002, due to redistribution using capital stocks data. This sector is around 7% of total economy value | New combined value is 67% higher on average than the old combined value due to redistribution using capital stocks data. This sector is around 5% of total economy value | This sector makes up 0.03% of total economy using Capital stock proportions; this value was previously 1.5% | This sector makes up 3% of total economy using National Inventory of Woodland and Trees; this value was previously 20% | ||||
| Public corporations | ||||||||
| S.11PR | New combined value is 105% higher on average than the old combined value due to redistribution using capital stocks data. This sector is around 5.5% of total economy value | New combined value is 33% higher on average than the combined value due to redistribution using capital stocks data. This sector is around 54% of total economy value | This sector makes up 66.7% of total economy using Capital stock proportions; this value was previously 5% | This sector makes up 15% of total economy using National Inventory of Woodland and Trees; this value was previously 20.5% | ||||
| Private-non financial corporations | ||||||||
| S.12 | Created using data on repossessions. This sector is <0.25% of total economy value | New combined value is 10% lower on average than the old combined value due to redistribution using capital stocks data. This sector is around 6% of total economy value | This sector makes up 0% of total economy using Capital stock proportions, same as previous value | This sector makes up 0% of total economy using National Inventory of Woodland and Trees; this value was previously 1.6% | ||||
| Financial corporations | ||||||||
| S.1311 | New combined value is 153% higher than the old combined value in 2015 and around 220% higher on average since 2002, due to redistribution using capital stocks data. This sector is around 0.7% of total economy value | New combined value is within 3% of the old combined value on average due to redistribution using capital stocks data. This sector is around 19% of total economy value | This sector makes up 5.2% of total economy using Capital stock proportions; this value was previously 2% | This sector makes up 22% of total economy using National Inventory of Woodland and Trees; this value was previously 0% | ||||
| Central government | ||||||||
| S.1313 | No dwellings in this sector | New combined value is 43% lower on average than the old combined value due to redistribution using capital stocks data. This sector is around 12% of total economy value | This sector makes up 0% of total economy using Capital stock proportions; this value was previously 3.5% | This sector makes up 6% of total economy using National Inventory of Woodland and Trees; this value was previously 6.4% | ||||
| Local government | ||||||||
| S.14 | New combined value is 6-8 % lower than the old combined value throughout due to redistribution using capital stocks data. This sector is around 88% of total economy value | New combined value is 61% lower on average than the old combined value due to redistribution using capital stocks data. This sector is around 1.4% of total economy value | This sector makes up 28.1% of total economy using Capital stock proportions; this value was previously 86.4% | This sector makes up 47% of total economy using National Inventory of Woodland and Trees; this value was previously 51.2% combined with NPISH. | ||||
| Households | ||||||||
| S.15 | No dwellings in this sector | New combined value is 28% lower on average than old combined value due to redistribution using capital stocks data. This sector is around 3.7% of total economy value | This sector makes up 0% of total economy using Capital stock proportions, same as previous value | This sector makes up 7% of total economy using National Inventory of Woodland and Trees; this value was previously 51.2% combined with households | ||||
| NPISH | ||||||||
| Source: Office for National Statistics | ||||||||
Download this table Table 5: Summary of all results by asset and sector
.xls (33.3 kB)Notes for: Land
For more information, please refer to Eurostat-OECD, 2015 paragraph 9.24.
For more information, please refer to paragraph 10.175 of the System of National Accounts 2008 and paragraph 3.187 of the European System of Accounts 2010.
For more information, please refer to paragraph 1.90 (page 16) of the European System of Accounts 2010.
For more information, please refer to the System of National Accounts 2008 (paragraph 10.175) and the European System of Accounts 2010 (Annex 7.1).
Sumit Dey-Chowdhury. (2008). Methods explained-Perpetual inventory method. Economic and Labour Market Review. 2 (9), page 48.
4. Non-profit institutions serving households and Household split
As part of the European System of Accounts 2010 (ESA10), there is a requirement to split S.14 Households (HH) and S.15 Non-Profit Institutions Serving Households (NPISH) sequence of accounts within the Blue Book and Quarterly National Accounts.
The change is being introduced as part of Blue Book 2017. The data will be taken back to 1997 due to user requirements and to maintain consistency with the rest of the national accounts.
This change will have no methodological impact on the non-financial assets on the balance sheet; however will affect the presentation of data. From Blue Book 2017, Households and NPISH data series will be presented in their own separate tables. The existing combined table will still be published.
Assets for which data are already available separately for household and NPISH level will be split using the existing data; net capital stock already has estimates at this level. The existing source of inventories data will be split to produce data for both sectors. Certain assets are only applicable to households; therefore data for these assets will remain solely within the household sector.
Estimates for financial assets have been produced for both sectors. Further information about the split can be found in other national accounts articles.
Nôl i'r tabl cynnwys5. Household price index (HPI)
5.1 Introduction
The methodology used to estimate the House Price Index (HPI) was improved in June 2016; the new estimates replaced the existing indices published separately by Office for National Statistics (ONS) and the Land Registry for England and Wales. It introduced improved methodology to address limitations with the previous house price indices that were published.
These changes will have an impact on the level of the index because the difference in the average price levels when comparing the new HPI to the old HPI is caused by the change in formula used for average prices. The new HPI uses a geometric mean, whereas the old HPI uses an arithmetic mean, as a result the index will not be as sensitive to extreme property values.
The second change is the impact on growth. The improved methodology does not have a significant impact on house price growth over time. More information on the methodology is available.
5.2 Impact on national balance sheet estimates
The House Price Index (HPI) is used as an input to estimate the combined value of dwellings and land. As the HPI methodology has changed, there will be an impact on dwellings. When the new House Price Index was released, the surrounding documentation explained that there would be a downward shift on the overall index due to the new methodology used. However, the input into the valuation of dwellings is not based on the level of the HPI, but the year on year percentage changes which are used to scale up average house prices by area, to get estimates of different house type values in each region of the United Kingdom. The effect of implementing the new HPI is that the valuation of dwellings is increased; Figure 7 shows the effect on the combined value, which has been published in NBS.
Figure 7: Comparison of old and new House Price Index (HPI) on the combined total of land and dwellings
UK, 1995 to 2015
Source: Office for National Statistics
Download this chart Figure 7: Comparison of old and new House Price Index (HPI) on the combined total of land and dwellings
Image .csv .xlsAs the NBS is changing to include land, the methods used to represent dwellings will also change.
As described in Section 3.4, the combined value will now be split; capital stocks data will now represent the value of dwellings in the UK.
The value of land will be affected by the new HPI as shown in Figure 8.
Figure 8: Comparison of old and new House Price Index (HPI) on land
UK, 1995 to 2015
Source: Office for National Statistics
Download this chart Figure 8: Comparison of old and new House Price Index (HPI) on land
Image .csv .xlsThe new HPI increases the land value up to 16 percent between 1995 and 2015.
Figure 9 shows the effect of the HPI on total economy level. The new HPI increases the total economy’s net worth between one and eight percent between 1995 and 2015.
Figure 9: Comparison of old and new House Price Index (HPI) on total economy
UK, 1995 to 2015
Source: Office for National Statistics
Download this chart Figure 9: Comparison of old and new House Price Index (HPI) on total economy
Image .csv .xls6. Annex A
Definitions
The definitions from Annex A are taken from the Eurostat and Organisation for Economic Co-operation and Development (OECD) Compilation guide on land estimation. These definitions relate to the System of National Accounts 2008 (SNA 2008) and the European System of Accounts 2010 (ESA 2010).
Balance sheet
The SNA 2008 (paragraph 13.2) defines a balance sheet as “a statement, drawn up in respect of a particular point in time, of the values of assets owned and of the liabilities owed by an institutional unit or group of units.”
Asset
An asset is a store of value representing a benefit or series of benefits accruing to the economic owner by holding or using the entity over a period of time. It is a means of carrying forward value from one accounting period to another (SNA 2008 paragraph 3.30, ESA 2010 paragraph 7.15)
Non-financial assets
Non financial assets (AN) are non financial items over which ownership rights are enforced by institutional units, individually or collectively, and from which economic benefits may be derived by their owners by holding, using or allowing others to use them over a period of time (ESA 2010 Annex 7.1).
Non financial assets are divided into produced (non financial) assets (AN.1) and non produced (non financial) assets (AN.2).
Non produced assets
Non produced assets (AN.2) are non financial assets that have come into existence in ways other than through processes of production (SNA 2008 paragraph 10.9b).
Non produced assets consist of three categories: natural resources; contracts, leases and licences; and purchased goodwill and marketing assets (SNA 2008 paragraph 10.14).
Land
Land (AN.211) consists of the ground, including the soil covering and any associated surface waters, over which ownership rights are enforced and from which economic benefits can be derived by their owners by holding or using them (SNA 2008 paragraph 10.175, ESA 2010 Annex 7.1).
For land it is important to note that this includes allowing others to use the land.
Dwellings
Buildings that are used entirely or primarily as residences, including any associated structures, such as garages, and all permanent fixtures customarily installed in residences.
Houseboats, barges, mobile homes and caravans used as principal residences of households are also included, as are public monuments (see AN.1121) identified primarily as dwellings.
Costs of site clearance and preparation are also included. Examples include residential buildings, such as one- and two-dwelling buildings and other residential buildings intended for non-transient occupancy.
Other buildings and structures
Other buildings and structures consist of buildings other than dwellings, other structures and land improvements, as defined in this section. Uncompleted buildings and structures are included to the extent that the ultimate user is deemed to have taken ownership, either because the construction is for own use or as evidenced by the existence of a contract of sale or purchase. Buildings and structures acquired for military purposes are included.
Land underlying buildings and structures
Land on which dwellings, non residential buildings and structures are constructed or into which their foundations are dug, including yards and gardens deemed an integral part of farm and non farm dwellings and their corresponding access roads. Land underlying buildings and structures also includes land underlying public or private transport infrastructure such as highways, streets, roads, railways and airfield runways; this includes bridges, elevated highways, tunnels and subways, and waterways.
Land underlying dwellings
Land on which dwellings are constructed or into which their foundations are dug, including yards and gardens deemed an integral part of farm and non farm dwellings and access roads to farm dwellings. Building land on which construction of dwellings takes place or for which such construction activities are planned, are included in this category as well.
Land underlying other buildings and structures
Land on which non residential buildings and structures are constructed or into which their foundations are dug, including land underlying public or private transport infrastructure such as highways, streets, roads, railways and airfield runways; this includes bridges, elevated highways, tunnels and subways, and water ways. Building land on which construction of non residential buildings or structures takes place or for which such construction activities are planned, are included in this category as well.
Land under cultivation
Land under cultivation encompasses agricultural land, forestry land and surface water used for aquaculture as defined in this section. Cultivation is defined as fostering the growth of something (plants, trees, animals) through human intervention.
Not included in this category is land underlying farm dwellings, farm buildings or other corresponding structures because, if possible, this should be included in land underlying buildings and structures.
Agricultural land
The total of land under temporary or permanent crops, meadows and pastures as well as land with temporary fallow; this category includes tilled and fallow land, and naturally grown permanent meadows and pastures used for grazing, animal feeding or agricultural purpose.
Forestry land
Land used for forestry. It does not include the forest itself, only the underlying land. Land that is predominantly used for agricultural purposes or urban use is also excluded.
Surface water used for aquaculture
Aquaculture refers to the farming of aquatic organisms: fish, molluscs, crustaceans, aquatic plants, crocodiles, alligators, turtles and amphibians. Farming implies some form of intervention in the rearing process to enhance production, such as regular stocking, feeding and protection from predators.
Recreational land and associated surface water
Land that is used as privately owned amenity land, parklands and pleasure grounds, and publicly owned parks and recreational areas, together with associated surface water.
Other land and associated surface water
All land within the asset boundary not elsewhere classified. Also included in this category are surface waters not captured by the other categories (for example, rivers).
Perpetual inventory model (PIM)
The perpetual inventory method (PIM) is an economic model that enables balance sheets (or stocks) to be calculated from the associated investment flows. It does this by accumulating past purchases of assets over their estimated service lives to estimate a gross capital stock measure.
Land improvements
The value of actions that lead to major improvements in the quantity, quality or productivity of land, or prevent its deterioration. Examples include the increase in asset value arising from land clearance, land contouring, creation of wells and watering holes. Also includes the costs of transfer of ownership of land, which have yet to be written off.
Costs of ownership transfer on non-produced assets
The costs of ownership transfer on non-produced assets other than land are shown separately in the capital account and treated as gross fixed capital formation. But in the balance sheets such costs are incorporated in the value of the asset to which they relate, even though the asset is non-produced. Therefore, there are no costs of ownership transfer shown separately in the balance sheets.
The costs of ownership transfer on financial assets are treated as “intermediate consumption”, where the assets are acquired by corporations or government, and “final consumption”, where the assets are acquired by households and exports of services where the assets are acquired by non-residents.
Nôl i'r tabl cynnwys7. Annex B
Methods
This section explains some of the methods in more detail than in the main body of the article.
Changes made to other buildings and structures combined value
One issue faced is the volatility of the series for land underlying other buildings and structures as a percentage of the combined value. For OBS during the economic downturn (2008 to 2009), the proportion drops to a minimum of 3.3%. This is caused by large falls in rateable values for buildings. It may be reasonable to expect the value of land to decline rapidly during an economic downturn as a result of significant falls in the demand for land for use in production activities; however the low of 3.3% in 2009 seems unreasonable.
Digging down into the calculation process it was found that the main source of the volatility is in the industrial and commercial buildings component of the calculation, some data were missing from these calculations, meaning that outputs for OBS were lower than expected. We will amend the calculation method of total economy other buildings and structures to include the missing data for Blue Book 2017, these changes do not have any sector-specific concerns as this adjustment affects the total economy proportionally.
Figure 10: Proportion of value of land to value of combined value for other buildings and structures
UK, 1995 to 2015
Source: Office for National Statistics
Download this chart Figure 10: Proportion of value of land to value of combined value for other buildings and structures
Image .csv .xlsThe corrected series in Figure 10 shows an improvement on the original data series, as the proportion of the value of land doesn’t fall below 14% of the total value. This change can be seen in Figure 4 of this article, whereby the old combined value is not equal to the new combined value.
Special cases
For the assets dwellings and other buildings and structures, there are some special cases that must be addressed.
1. Land owned by residents of other countries
When UK land is owned by a non-resident entity, then a “notional resident unit” is considered as being the resident owner of the land. The non-resident owns the notional resident unit, rather than owning the land directly. So there is an equity liability of the resident notional unit to the non-resident, but the land itself is always an asset of the economic territory in which it is located (European System of Accounts 2010, paragraph 18.15 to 18.16).
Therefore, only resident institutions can own immovable physical assets. In this sense, a UK institutional unit does not own land in a foreign economy (and vice versa). However, what it owns is the direct investment in the ownership of the notional entity that has been created. This is a financial relationship relating to equity rather than the ownership of a physical asset, for example, land.
In other words, while foreign institutional units can own the financial assets of and incur financial liabilities from domestic institutional units, they cannot own non-financial assets in the domestic economy, but may rather own the financial assets of the domestic unit that owns the non-financial assets.
As a result of this feature of the accounts, no land in foreign economic territories are included in the values in the balance sheet. Therefore, there is no need to create a negative adjustment to land underlying other buildings and structures. Similarly, no estimate of the value of land owned by UK residents abroad is needed.
2. Extraterritorial enclaves
There is one exception to the principle that land is always an asset of the country (geographically speaking) in which it is located and this relates to the definition of economic territory. The European System of Accounts 2010 paragraph 2.05 describes economic territory as the following:
the area (geographic territory) under the effective administration and economic control of a single government
any free zones, including bonded warehouses and factories under customs control
the national air-space, territorial waters and the continental shelf lying in international waters, over which the country enjoys exclusive rights
territorial enclaves, these being geographic territories situated in the rest of the world and used, under international treaties or agreements between states, by general government agencies of the country (such as embassies, consulates, military bases and scientific bases)
deposits of oil and natural gas among other things in international waters outside the continental shelf of the country, worked by units resident in the territory as defined in the previous points
It also describes economic territory as excluding the following:
Economic territory excludes extraterritorial enclaves.
Also excluded are the parts of the country’s own geographic territory used by the following organisations:
general government agencies of other countries
institutions and bodies of the European Union
international organisations under international treaties between states
Land and buildings in extraterritorial enclaves of foreign governments, such as land underlying embassies, consulates, military bases and international organisations under international treaties between states, are considered to be the economic territory of their home country regardless of where they are geographically located. Similarly, territorial enclaves belonging to the UK but situated abroad are still regarded as part of UK economic territory. This means that territorial enclaves of the UK in other countries should be included in the UK balance sheet and extraterritorial enclaves in the UK under the control of other governments should be subtracted from the UK balance sheet.
There are currently 267 UK embassies and consulates around the world whose value is estimated by independent valuation companies on behalf of the Foreign and Commonwealth Office (FCO). The valuation of UK embassies and consulates in March 2015 was £1.12 billion, which is approximately 0.05% of total other buildings and structures (OBS).
There are no adjustments made for extraterritorial enclaves within the UK for the asset other buildings and structures in National Balance Sheet. It is assumed that the values of enclaves in the UK held by foreign governments are approximately equal in value to those abroad held by the UK; however this assumption should be reviewed as part of future development work on the UK non-financial balance sheet.
3. Splitting other buildings and structures into lower-level assets
For the asset other buildings and structures, international transmissions require that this is broken down further into buildings other than dwellings (AN.1121) and other structures (AN.1122) for the years 2012 onwards (European System of Accounts 2010, Transmission programme of data, Table 26). This split will need to be made to estimate a residual value of land underlying the respective assets.
It is proposed that a proportional split is taken from the national balance sheet (NBS) dataset at total economy level (S.1), for each year. NBS data will be used due to the fact there is no net capital stock for buildings other than dwellings and other structures.
This is because the source of gross fixed capital formation (GFCF), which feeds into net capital stock, the Quarterly Acquisitions and Disposals of Capital Assets (QCAS) survey, does not contain a split between buildings other than dwellings and other structures.
The split between AN.1121 and AN.1122 from the NBS will be applied when splitting out land.
4. Separating land improvements from land
Land improvements are activities such as land clearance, contouring or the creation of watering wells that lead to the improvement of land (in addition, land improvements, by convention, includes the value of transfer costs on land). Land improvements are produced fixed assets and make up the asset other buildings and structures (OBS). When calculating the residual value of land underlying OBS, land improvements should be separated from land (Eurostat and Organisation for Economic Co-operation and Development (OECD) Compilation guide on land estimation, paragraph 2.4). In short, this is due to land improvements being categorised as a produced non-financial asset and land being a non-produced asset, therefore, the value of land should not contain the value of any land improvements.
However, separating the two assets can be complex as land improvements are currently not capitalised in the higher level asset, OBS. This is because land improvements are not currently put through the PIM; only the assets buildings other than dwellings and other structures are capitalised. In NBS, it is not included in its higher level asset, OBS.
Ideally, land improvements should be capitalised in the PIM, since they are a produced fixed asset, however it is recognised that investigation would have to be done into the data sources for land improvements.
5. Treatment of the asset dwellings for financial corporations
Although financial corporations (S.12) are recorded as owning dwellings in NBS, this is not mirrored in net capital stocks. This is because currently no GFCF is estimated for S.12 for dwellings, thus there is no capital stock estimated by the PIM. This causes an issue with how S.12 is integrated into the residual method, as only the combined value component is available.
One reason for the absence of S.12 in net capital stock concerns how the second-hand market is measured in GFCF. However, the inclusion of S.12 in NBS is correct since it measures the net stream of repossessions in the UK economy. This causes the S.12 dwellings series to be volatile over time. It is likely that in periods of housing market crisis, or of high interest rates, the stock of dwellings owned by S.12 will increase. Essentially, this is an issue of recording the acquiring or surrendering of dwellings as capital transfers in kind, for which there are no established source information utilised at present for estimating GFCF. While desirable to estimate for analytical purposes, it is highly likely that any particular dwelling does not remain with the financial corporation for longer than that financial corporation takes to sell the dwelling and land.
6. Land type splits for arable land
Where irrigable arable land area exceeds 15% of the total area and the price is more than 50% higher than the price for the non-irrigable arable land per hectare, it is recommended to report separately for each type of arable land (Eurostat and Organisation for Economic Co-operation and Development (OECD) Compilation guide, 2015, paragraph 8.11). There is no distinction in the current data sources between irrigable and non-irrigable arable land, so they cannot be estimated separately.
7. Kitchen gardens
Kitchen gardens are sometimes referred to as another category of agricultural land. Kitchen gardens are where farm households have a garden in which they grow produce for their own final consumption or which can then be sold as market output. For this purpose they will be included under land underlying buildings and structures as they are not of considerable importance (Eurostat and Organisation for Economic Co-operation and Development (OECD), 2015, paragraph 8.8), therefore no estimation or adjustments will be made.
Nôl i'r tabl cynnwys8. Annex C
Communication
Consultation and outside interest
The methods process has involved consultation with the following areas:
Environmental Accounts
Housing Market Indices
Household Expenditure
Department for Environment, Food and Rural Affairs (DEFRA)
Forestry Commission
Bank of England
Statistics Austria
9. Annex D
References
A number of references were used to produce this article:
Eurostat (2010) European System of National and Regional Accounts (ESA 2010)
United Nations Statistics (2009) System of National Accounts (2008)
Office for National Statistics (2016) National Balance Sheet (NBS)
Department of Environment, Food and Rural Affairs (DEFRA) (2016) Agricultural balance sheet 2015