Cynnwys
- Main points
- Introduction
- Changes introduced in Blue Book 2016
- Imputed rental
- Estimated impact of Blue Book 2016 on GDP: 1997 to 2014
- GDP implied deflator
- The economic downturn and recovery: GDP and GDP per capita
- Revisions to the expenditure components of GDP
- Gross Fixed Capital Formation
- Net Trade
- Revisions to GDP
- Productivity
- Impact articles published
- Publication schedule for Blue Book and Pink Book 2016
1. Main points
Changes introduced in Blue Book 2016 act to raise the level of current price GDP by 3.3% per year on average between 1997 and 2014, but by much less than this in each of the years between 2011 and 2014. The main cause of upward revisions to GDP in current prices is a revised treatment of owner occupiers’ imputed rental.
Estimates of the average annual growth rate of real GDP between 1997 and 2014 are broadly unchanged at 2.0%, although estimates of annual growth in 2010, 2012 and 2014 have been strengthened by 0.4, 0.1 and 0.3 percentage points respectively, while growth in 2011 and 2013 has been revised down by 0.5 and 0.2 percentage points respectively.
Although the largest revisions in recent years come from the revised treatment of owner occupiers’ imputed rental, a range of other methods changes and new data have also had an effect on both the level and growth rates of GDP.
Revisions to real GDP, in both directions, have slightly altered the profile of the UK’s economic recovery, while leaving its overall magnitude broadly unaffected. The UK economy is now thought to have recovered its pre-downturn level of output in Quarter 3 (July to Sep) 2013: one quarter later than previously thought. These revisions notwithstanding, the recovery immediately following the 2008 to 2009 economic downturn remains the weakest in the past half-century.
The Blue Book 2016 changes do little to alter the broad economic narrative of recent years. In particular, they do not significantly alter the scale of the ‘productivity puzzle’.
Nôl i'r tabl cynnwys2. Introduction
This edition of the Economic Review examines the impact of methodological and data changes being introduced to the National Accounts in the Blue Book 2016. These changes are designed to ensure that official statistics reflect the changing nature of the UK and global economies, to enable fair and meaningful international comparisons and to permit analysis of current economic trends on the best available data.
In aggregate the effect of these changes is to raise the level of current price GDP by £38.4 billion (3.3%) on average per year between 1997 and 2014. However, this varies depending on the period considered. The level of current price GDP was revised up by around £49.6 billion per year between 1997 and 2009, or around 4.3%. But the impact is much smaller in more recent years: increasing the level of current price GDP by 0.6% between 2010 and 2014. These changes are more sizeable than those introduced in Blue Book 2015, which increased the level of current price GDP by 0.3% per year on average between 1997 and 2013.
Very little of the revision to the current price measure has been directly passed through to chained volume estimates of GDP, due to the nature of the methods changes in this Blue Book (discussed further in the imputed rent section of this article). Over the 1997 to 2014 period as a whole, the compound average quarterly growth rate of real GDP is unrevised at 0.5%. However, the changes introduced in Blue Book 2016 have had the largest effect on growth of real GDP in the post-downturn period, with growth being strengthened in some years, and weakened in others. These revisions have the effect of slightly altering estimates of growth during the recovery, with a corresponding impact on the recoveries of both GDP per capita and productivity. However, the changes introduced do not change the broad profile of GDP per capita or the ‘productivity puzzle’.
This edition of the Economic Review first sets out some details of the specific changes to be introduced in Blue Book 2016, providing information on where further details can be found. It then considers their impact on current price and chained volume estimates of GDP, before setting out indicative estimates of the expenditure measure of GDP. The final sections examine the implications for the economic recovery and the UK’s productivity performance.
Nôl i'r tabl cynnwys3. Changes introduced in Blue Book 2016
The methodological changes presented in Blue Book 2016 are fewer in number than corresponding publications in 2014 and 2015. Blue Book 2014 introduced a range of changes to adhere to the European System of Accounts (ESA) 2010 and Balance of Payments Manual (BPM) 6, while Blue Book 2015 addressed some remaining Gross National Income (GNI) reservations and some important classification decisions.
This year’s publication contains some important methods changes which, taken together with some new sources and the incorporation of new data, alter the level and profile of some main National Accounts aggregates.
Details of these changes – including the specific data involved and methodologies used – have been published by the Office for National Statistics (ONS) in articles over recent months. The most substantial change involves improvements to the method used to estimate the imputed rental of owner occupiers. In addition, revised ‘exhaustiveness’ estimates are designed to account for, (a) under-coverage of income accruing to small businesses and (b) income concealed through the evasion of taxes.
Several other changes are due to be implemented that also have a smaller impact on National Accounts aggregates, including measures to:
continue reconciliation between the Public Sector Finance statistics and the National Accounts
improve estimates of illegal activities
implement a classification change to Transport for London into the estimates for Capital Stocks and thereby capital consumption
re-classify London and Continental Railways to the Public Corporations sub-sector from Central Government
include the London Crossrail Business rates supplement
incorporate a methods change made by HM Revenue & Customs for the import and export of gas
incorporate industry review changes for the water transport industry and post and courier industry
Finally, revisions have also occurred due to the introduction of newly available survey data. Reflecting the long time-lags associated with some datasets, these data have an impact on 2012, 2013 and 2014. This includes new data from the Annual Business Survey (years up to and including 2014), the International Trade in Services survey (2014) and on wages and salaries from HMRC (up to 2013/14).
Indicative estimates of the impact of these methodological and data improvements to the National Accounts have been the subject of several recent articles. As near-final data have become available, articles have been published on their impact on current price and real Gross Domestic Product (GDP) for the years 1997 to 2011 and the years 1997 to 2014. In the spirit of these articles, all of the data considered here are near-final only, as there may be minor adjustments to the data before their final publication. Further details on these changes and new data – including the quarterly series up to and including Quarter 1 (Jan to Mar) – will be published with the Blue Book 2016 consistent Quarterly National Accounts (QNA) dataset on 30 June 2016.
Nôl i'r tabl cynnwys4. Imputed rental
While the number of methodological changes is smaller in Blue Book 2016, the publication incorporates a methods change to measuring owner occupiers’ imputed rent, which is one of the more substantial changes to the National Accounts in recent years.
Since the System of National Accounts (SNA) 1993 was introduced, there has been a requirement for National Statistics Institutes to incorporate owner occupiers’ imputed rents into the National Accounts. These are the housing services that accrue to households which own a property and reside in it: therefore avoiding the cost of renting an equivalent property.
This activity is not directly observable, as it does not involve a financial transaction such as those in the private rented sector, but is important to capture. For example, if the measure were not included, a shift away from owner occupation toward the private rental sector would (all else equal) act to raise GDP, even though the provision of housing services would be the same. Similarly, it would be more difficult to compare GDP levels across countries with different rates of owner occupation if this measure were not taken into account. As might be expected given the relatively high levels of owner occupation in the UK, the value of owner occupiers’ imputed rental accounts form a substantial proportion of economic activity (approximately 10% of GDP and 17% household consumption in 2013).
ONS has taken the decision to change the methodology that is used to impute owner occupiers’ rent. The broad principle of valuing imputed rent in current prices is to assign a rental value to an owner occupied property, which is the same as the rental which would be paid for a similar property in the private rented sector. The new method uses Valuation Office Agency (VOA) data to calculate rental prices and Department for Communities and Local Government (DCLG) data to estimate the number of dwellings – this now allows for a more robust sample size and stratification approach1.
The owner occupiers’ housing costs component of the CPIH is then used to deflate the current price series, whereas previously a volume measure was calculated independently. Further information can be found in the imputed rent methods article.
The methods change acts to raise the level of current price imputed rent in 1997 by £56.7 billion, with the magnitude of the annual upward revision then declining in successive years. For example the level was revised up by £37.4bn in 2009 and by just £16.4bn in 2013 – the last year for which data are currently available at this level of detail (data for 2014 onwards have been produced using the same methodology, and will be published on 30 June 2016). The impact of the methods change on the value and volume growth of owner occupiers’ imputed rental is set out in Figure 1. This shows that the new method consistently acts to revise down current price imputed rent growth between 1998 and 2010 by between 1.3 and 16.3 percentage points each year, while there are smaller effects in later years. The revisions to the current price data – in both levels and growth rate terms - can be attributed to the VOA measure of equivalent rental prices differing to the previous measure of price based on the Living Costs and Food Survey (LCF). As previously stated, these changes pass through to revised GDP estimates with a weight of approximately 10%.
As ONS are changing the way that both the current price and volume measures of owner occupiers’ imputed rent are calculated (and are moving away from the latter being measured independently of the former), revisions to the current price and volume measures of GDP will differ in scale. Figure 1 shows that the revisions to volume growth are smaller than the revisions to current price growth, and may be either positive or negative in direction.
Figure 1: Commodity 04.2 - imputed rentals for housing, in the UK
Current prices and chained volume measure, year on year growth rates 1998 to 2013
Source: Office for National Statistics
Download this chart Figure 1: Commodity 04.2 - imputed rentals for housing, in the UK
Image .csv .xls'Notes for Imputed rental
- Further information on the previous method used was set out by Richardson and Dolling (2005).
5. Estimated impact of Blue Book 2016 on GDP: 1997 to 2014
Current price estimates
The impact of the Blue Book 2016 changes on current price GDP is considerably larger than that resulting from Blue Book 2015. Figure 2 presents the previously published quarterly current price level of nominal GDP, compared with indicative estimates consistent with Blue Book 2016. It shows that changes to the National Accounts had a relatively steady impact between 1997 and 2009, increasing the estimate of GDP by £49.6 billion per annum on average over this period, or around 4.3%. The revisions are smaller in latter periods, on average increasing GDP by £9.1 billion between 2010 and 2014, equivalent to 0.6%.
Figure 2: Current price GDP levels: previously published compared with indicative Blue Book 2016
Current price, seasonally adjusted, Quarter 1 1997 to Quarter 4 2015
Source: Office for National Statistics
Notes:
- Indicative Blue Book 2016 estimates are currently only available to Quarter 4 (Oct to Dec) 2014.
Download this chart Figure 2: Current price GDP levels: previously published compared with indicative Blue Book 2016
Image .csv .xlsFigure 3 divides the revision to the current price level of GDP into 4 broad categories: those arising from the revised treatment of imputed rental, new ‘exhaustiveness measures’ to better measure activity, other methods changes (for example, the revised treatment of the import of gas) and revisions arising from the incorporation of new data. It shows that the majority of the revisions over the period since 1997 are related to the revised treatment of owner occupiers’ imputed rental. This methods change accounts for much of the upward revision to nominal GDP in the early years of this series, and is only partly offset by other methods changes that taken together make a consistent downward revision. The incorporation of new data also results in small downward revisions to GDP growth in 2013 and 2014 for these contributions, the latter of which has been affected by the Supply-Use balancing process for the first time.
Figure 3: Contributions to the revisions to current price GDP: previously published compared with Blue Book 2016
Current price, £ billion, 1997 to 2014
Source: Office for National Statistics
Download this chart Figure 3: Contributions to the revisions to current price GDP: previously published compared with Blue Book 2016
Image .csv .xlsA gradually declining upward revision to nominal GDP has resulted in small consistent downward revisions to nominal GDP growth over this period. Figure 4 shows the quarter on same quarter a year ago growth rate for the previously published and indicative Blue Book 2016 series, which were presented in Figure 2. Taking the Quarter 1 (Jan to Mar) 1998 to Quarter 4 (Oct to Dec) 2014 period as a whole, the average revision to quarter on same quarter a year ago growth is -0.4 percentage points. Although the largest revisions to the level of current price GDP occurred between 1997 and 2009, the average revision to the growth rate between 1998 and 2009 (-0.3 percentage points per quarter) was smaller than that between 2010 and 2014 (-0.4 percentage points per quarter).
Figure 4: Current price GDP quarter on same quarter a year ago growth rates: previously published compared with indicative Blue Book 2016
%, Current price, seasonally adjusted, Quarter 1 1998 to Quarter 4 2015
Source: Office for National Statistics
Notes:
- Indicative Blue Book 2016 estimates are currently only available to Quarter 4 (Oct to Dec) 2014.
Download this chart Figure 4: Current price GDP quarter on same quarter a year ago growth rates: previously published compared with indicative Blue Book 2016
Image .csv .xlsConstant price (Chained volume measure)
All else equal, revisions to current price GDP would typically pass through to revisions to real GDP. However, due to the nature of the imputed rental methods change, Blue Book 2016 has had a relatively modest impact on the growth of the chained volume measure of GDP over the 1998 to 2014 period, with smaller revisions compared with the changes to current price GDP.
Figure 5 shows the quarter on same quarter a year ago growth rates for real GDP on both a previously published and Blue Book 2016 basis. Taking the period as a whole, the average compound quarterly growth rate of the UK economy is unchanged to one decimal place: averaging 0.5% per quarter between Q1 1997 and Q4 2014. Growth has been revised most notably upward in Q3 and Q4 2010 (by 0.6% and 0.5% respectively), and most notably downward in Q3 and Q4 2011 (by -0.8% in both quarters).
Figure 5: Real GDP quarter on same quarter a year ago growth rates: previously published compared with indicative Blue Book 2016
%, Chained volume measure, seasonally adjusted, UK, Quarter 1 1998 to Quarter 4 2015
Source: Office for National Statistcs
Notes:
- Indicative Blue Book 2016 estimates are currently only available to Quarter 4 (Oct to Dec) 2014.
Download this chart Figure 5: Real GDP quarter on same quarter a year ago growth rates: previously published compared with indicative Blue Book 2016
Image .csv .xlsAlthough the compound average calendar year growth rate for the whole period is unrevised at 2.0%, the revisions for single years vary between -0.5 and +0.4 percentage points. While the changes to earlier years are generally relatively modest, the revisions towards the end of the period tend to be larger, when the impact of both new data and methods changes is greatest. Real GDP growth in 2010, 2012 and 2014 are all revised upwards on an annual basis, by 0.4, 0.1 and 0.3 percentage points respectively, but 2011 and 2013 are revised down by -0.5 and -0.2 percentage points respectively.
Table 1: Revision to annual real GDP growth: previously published compared with Blue Book 2015, chained volume measure, seasonally adjusted
| % | Percentage points | |||
| Previously published | Blue Book 2016 | Difference | ||
| 1998 | 3.4 | 3.2 | -0.2 | |
| 1999 | 3.1 | 3.3 | 0.2 | |
| 2000 | 3.8 | 3.7 | -0.1 | |
| 2001 | 2.8 | 2.7 | 0.0 | |
| 2002 | 2.5 | 2.4 | -0.1 | |
| 2003 | 3.3 | 3.5 | 0.1 | |
| 2004 | 2.5 | 2.5 | 0.0 | |
| 2005 | 3.0 | 3.0 | 0.0 | |
| 2006 | 2.7 | 2.5 | -0.2 | |
| 2007 | 2.6 | 2.6 | 0.0 | |
| 2008 | -0.5 | -0.6 | -0.2 | |
| 2009 | -4.2 | -4.3 | -0.1 | |
| 2010 | 1.5 | 1.9 | 0.4 | |
| 2011 | 2.0 | 1.5 | -0.5 | |
| 2012 | 1.2 | 1.3 | 0.1 | |
| 2013 | 2.2 | 1.9 | -0.2 | |
| 2014 | 2.9 | 3.1 | 0.3 | |
| 2015 | 2.3 | |||
| Source: Office for National Statistics | ||||
| Note: | ||||
| 1. Figures may not sum due to rounding. | ||||
Download this table Table 1: Revision to annual real GDP growth: previously published compared with Blue Book 2015, chained volume measure, seasonally adjusted
.xls (19.5 kB)6. GDP implied deflator
Substantial downward revisions to current price GDP growth during the period up to 2009, set against a broadly unchanged picture for real GDP growth, imply an equivalent set of downward revisions to growth in the implied GDP deflator. Figure 6 compares quarter on previous year growth in the implied GDP deflator, in the latest published series and indicative estimates for Blue Book 2016. This shows a corresponding consistent downward revision to growth in the implied GDP deflator, which equates to approximately 0.3 percentage points per annum on a calendar year basis.
The revisions prior to 2010 can be almost entirely attributed to the imputed rental methods change, as the corresponding implied deflator is revised to align with owner occupiers’ housing costs (this shows lower growth than the implied deflator calculated under the previous method). There is a more substantial revision to the deflator in 2010, where calendar year growth was revised down 1.6 percentage points to 1.5%. This reflects the fact that the imputed rental deflator was already aligned to the owner occupiers’ price index from CPIH from 2011 onwards – and applying the new method from 1997 to 2010 removed a discontinuity in method.
Figure 6: Comparison of the implied GDP deflator: quarter on previous year growth, per cent, previously published compared with indicative Blue Book 2016
Seasonally adjusted, Quarter 1 1998 to Quarter 4 2014
Source: Office for National Statistcs
Download this chart Figure 6: Comparison of the implied GDP deflator: quarter on previous year growth, per cent, previously published compared with indicative Blue Book 2016
Image .csv .xls7. The economic downturn and recovery: GDP and GDP per capita
As a consequence of these revisions, the profile of real GDP following the most recent economic downturn has changed slightly. However, the broad timing and depth of the downturn in 2008 to 2009 stays the same, and the overall magnitude of the recovery immediately following the downturn remains the weakest of the past half-century (Figure 7).
The 2008 to 2009 recession is a little deeper than previously estimated. The cumulative fall in output between the peak and trough (Q1 2008 to Q2 2009), which was previously estimated to have been 6.1%, has increased slightly to 6.3%. The overall strength of the recovery is largely unrevised, but the timing has shifted slightly: this resulted in UK output regaining its pre-downturn peak in Q3 (July to Sept) 2013, one quarter later than previously estimated. However stronger growth in 2014 means that the UK economy is estimated to have surpassed its pre-downturn peak by 4.7% by Quarter 4 (Oct to Dec) 2014, compared with the 4.6% as previously published. Notably, as shown in Figure 7, the recovery immediately following the 2008 to 2009 economic downturn remains weak by historical standards.
Figure 7: Comparison of GDP growth following pre-downturn peaks: previously published compared with indicative Blue Book 2016
Index, pre-downturn peak = 100, Chained volume measure, seasonally adjusted
Source: Office for National Statistics
Notes:
- Indicative Blue Book 2016 estimates are currently only available to Quarter 4 (Oct to Dec) 2014.
Download this chart Figure 7: Comparison of GDP growth following pre-downturn peaks: previously published compared with indicative Blue Book 2016
Image .csv .xlsThese changes to the strength of the recovery also have a bearing on the level of real GDP per capita, which is an important indicator of living standards. On a Blue Book 2016 basis, output per capita in Q4 was -0.4% below its pre-downturn peak – little different from the previously published figure, -0.5% (Figure 8). The profile of this series will be updated to Q1 2016 in the QNA publication on 30 June, when Blue Book 2016 consistent estimates of GDP will be published.
Figure 8: GDP per capita: Previously published compared with indicative Blue Book 2016: Quarter 1 2008=100
Chained volume measure, seasonally adjusted, UK, Quarter 1 1997 to Quarter 4 2014
Source: Office for National Statistics
Notes:
- Indicative Blue Book 2016 estimates are currently only available to Quarter 4 (Oct to Dec) 2014.
Download this chart Figure 8: GDP per capita: Previously published compared with indicative Blue Book 2016: Quarter 1 2008=100
Image .csv .xls8. Revisions to the expenditure components of GDP
The changes introduced in Blue Book 2016 affect some of the expenditure components of GDP to a greater degree than others. Figure 9 plots the contribution from each headline expenditure component to the revision to calendar year real GDP growth, to show the drivers of the revisions. It highlights that Household Final Consumption Expenditure (HHFCE) – the largest component of the expenditure measure of GDP – makes the largest or joint largest contribution to the revision in 13 of the 17 years presented, and has a notable impact on 2010 and 2011. This is to be expected, given the scope of the imputed rental change previously stated.
While there have been some revisions to the expenditure breakdown of GDP, the latest data does not change the broad composition of the recent recovery. This is shown in the quarterly expenditure detail, which is set out in more detail for the first time in the following sections. These quarterly expenditure estimates should be considered near-final only, as there may be minor adjustments to the data before final publication.
The majority of growth in the expenditure measure of GDP since the economic downturn (comparing Q2 2009 with Q4 2014) has still come from household consumption and investment growth, with government consumption making a smaller positive contribution and net trade acting as a slight drag on GDP. However downward revisions to household consumption growth during the recent recovery mean that the component now accounts for 4.6 percentage points of the 11.7% growth in GDP experienced between Q2 2009 and Q4 2014, as opposed to 5.3 percentage points of the 11.5% GDP growth shown in the previously published data. This indicates that the recent recovery was slightly less reliant on household consumption expenditure than previously estimated.
Figure 9: Contributions of the components of the expenditure measure of GDP to aggregate GDP revisions: Blue Book 2016 compared with previously published
Chained volume measure, seasonally adjusted, 1998 to 2014
Source: Office for National Statistics
Notes:
- Figures may not sum due to rounding. Indicative Blue Book 2016 estimates are currently only available to 2014.
Download this chart Figure 9: Contributions of the components of the expenditure measure of GDP to aggregate GDP revisions: Blue Book 2016 compared with previously published
Image .csv .xlsHousehold spending
The new method for imputed rental introduced in Blue Book 2016 had a substantial impact on calendar year household consumption growth; however this is shown to not significantly alter the broad quarterly path of HHFCE. Figure 10 compares the quarter on same quarter a year ago growth rates for real HHFCE on both a previously published and Blue Book 2016 basis. Between Q1 1998 and Q4 2008 HHFCE growth was revised down by 0.2 percentage points on average per quarter - consistent with the calendar year revisions attributable to the imputed rental methods change – while there were slightly larger revisions within the 2011, 2013 and 2014 calendar years. Taking the period as a whole, the compound average quarterly growth rate of real household consumption is only slightly lower at 0.5% compared to 0.6% in the previously published data.
Figure 10: Real households’ final consumption expenditure, quarter on same quarter a year ago growth rates: previously published compared with indicative Blue Book 2016
Chained volume measure, seasonally adjusted, Quarter 1 1998 to Quarter 4 2015
Source: Office for National Statistics
Notes:
- Indicative Blue Book 2016 estimates are currently only available to Quarter 4 (Oct to Dec) 2014.
Download this chart Figure 10: Real households’ final consumption expenditure, quarter on same quarter a year ago growth rates: previously published compared with indicative Blue Book 2016
Image .csv .xls9. Gross Fixed Capital Formation
Blue Book 2016 contained only a small number of methodological changes to the components of Gross Fixed Capital Formation (GFCF). As a result the profile of fixed investment in early years remains broadly unchanged, as shown in Figure 11 which plots quarter on same quarter a year ago GFCF growth. However there are larger revisions to calendar year growth in some later years. Growth in 2008 and 2009 has been revised down by 0.6 and 0.8 percentage points respectively, which can be attributed to revised dwellings, agriculture and own account construction data. New ABS data – which is based on audited accounts – also led to upward revisions to growth in 2012 and 2013 (by 0.8 and 0.6 percentage points respectively) and a 0.6 percentage point downward revision to growth in 2014.
Figure 11: Quarter on same quarter a year ago growth rate of Gross Fixed Capital Formation: previously published compared with indicative Blue Book 2016
Chained volume measure, seasonally adjusted, Quarter 1 1998 to Quarter 4 2015
Source: Office for National Statistics
Notes:
- Indicative Blue Book 2016 estimates are currently only available to Quarter 4 (Oct to Dec) 2014.
Download this chart Figure 11: Quarter on same quarter a year ago growth rate of Gross Fixed Capital Formation: previously published compared with indicative Blue Book 2016
Image .csv .xlsTaken together however, these changes do little to alter the broad narrative of investment in the recent recovery (Figure 12). On a Blue Book 2016 basis, at the end of 2014 GFCF was 1.5% below Q1 2008 levels, compared with just 0.2% on a previously published basis.
Figure 12: Gross Fixed Capital Formation, previously published compared with indicative Blue Book 2016, Quarter 1 2008=100
Chained volume measure, seasonally adjusted, Quarter 1 1997 to Quarter 4 2015
Source: Office for National Statistcs
Notes:
- Indicative Blue Book 2016 estimates are currently only available to Quarter 4 (Oct to Dec) 2014.
Download this chart Figure 12: Gross Fixed Capital Formation, previously published compared with indicative Blue Book 2016, Quarter 1 2008=100
Image .csv .xls10. Net Trade
Alongside the revisions to household consumption, methods changes introduced in Blue Book 2016 have also affected estimates of exports, imports and net trade. This year there are a number of methods changes for trade components, which include:
revised treatment of exhaustiveness and concealed income which affects exports of goods and services
a change in the methodology for measuring non-EU gas imports
improvements to the export and import of housing services relating to foreign owned second homes in the UK and foreign second homes owned by UK residents
revisions to the volume of trade in services, due to changes in deflator weights
The impact of these changes is shown in Figure 13, which presents the levels of exports and imports on an indicative Blue Book 2016 and previously published basis, indexed to their respective values in Quarter 1 (Jan to Mar) 2008. It suggests that the growth of both exports and imports has been revised up slightly since the 2008 to 2009 economic downturn.
Figure 13: Exports and imports: previously published compared with indicative Blue Book 2016, Quarter 1 2008=100
Chained volume measure, seasonally adjusted, Quarter 1 2008 to Quarter 4 2015
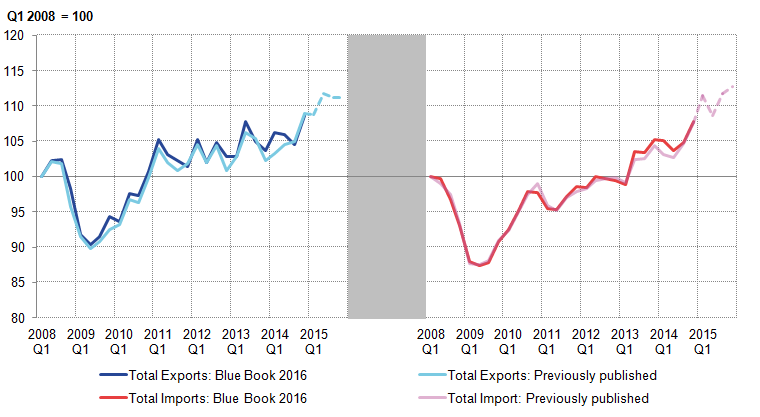
Source: Office for National Statistics
Notes:
- Indicative Blue Book 2016 estimates are currently only available to Quarter 4 (Oct to Dec) 2014.
Download this image Figure 13: Exports and imports: previously published compared with indicative Blue Book 2016, Quarter 1 2008=100
.png (27.5 kB) .xls (30.2 kB)
The Blue Book 2016 changes to imports and exports result in revisions to the contribution of net trade to GDP over this period. Figure 14 shows the contribution of net trade to quarter on same quarter a year ago growth, on a previously published and an indicative Blue Book 2016 basis, as well as the revision between the two. It reflects the modest changes to growth rates presented in Figure 13, and suggests that net trade continues to switch between periods of both supporting GDP growth and acting as a drag on GDP growth. Taken together, net trade has made broadly zero contribution to GDP between 2007 and 2014.
Figure 14: Net trade contribution to GDP growth: previously published compared with indicative Blue Book 2016, percentage points
Chained volume measure, seasonally adjusted, Quarter 1 2007 to Quarter 4 2014
Source: Office for National Statistics
Notes:
- Indicative Blue Book 2016 estimates are currently only available to Quarter 4 (Oct to Dec) 2014.
Download this chart Figure 14: Net trade contribution to GDP growth: previously published compared with indicative Blue Book 2016, percentage points
Image .csv .xls11. Revisions to GDP
Each year the Blue Book publications incorporate new methods, changes to the coverage of the National Accounts and the incorporation of newly available data, which can all have an impact on the revised estimates of real GDP growth and can affect our understanding of the recent performance of the UK economy.
These revisions reflect the results of a trade-off: Early estimates of GDP – which utilise all the information available at the time – provide users with a timely indication of current economic trends. Estimates compiled over a longer period – which can incorporate more complete, but less timely data sources utilising more comprehensive methods – can give users a more precise picture of the UK economy’s recent performance, albeit with a time-lag.
ONS publishes regular revisions assessments - including international comparisons of revisions – every year to monitor the ongoing effect of National Accounts changes. Figure 15 looks at one metric which has been referred to in these revisions articles: the revision between the preliminary (T) estimate – compiled just 25 days after the end of the quarter to which it refers – and a more complete (T+60) estimate published 5 years after the period to which it referred (by which time all changes due to new data have been incorporated). Comparing the preliminary estimate (T) and (T+60) measures over this period shows a relatively strong relationship between the initial estimate and the corresponding estimate 5 years later. Comparing the difference between T+60 and the Blue Book 2016 data provides an estimate of how methods changes, which often occur later in the process, also affect the GDP estimates. While the magnitude of any single quarterly estimate may change over this period, the difference is shown to rarely alter the broad economic narrative.
Figure 15: GDP revisions, quarter on same quarter a year ago growth rate, T, T+60 and BB16
Chained volume measure, seasonally adjusted, Quarter 1 1998 to Quarter 4 2014
Source: Office for National Statistics
Notes:
- ‘T’ shows the preliminary estimate and ‘T+60’ shows the estimate published 5 years after the period to which it refers.
Download this chart Figure 15: GDP revisions, quarter on same quarter a year ago growth rate, T, T+60 and BB16
Image .csv .xlsWhile the preliminary and T+60 estimates of GDP growth have been quite similar over recent years, there is some evidence that revisions tend to be slightly larger around turning points in the economic cycle. This likely reflects the greater level of difficulty involved in estimating GDP growth as the economy is changing direction and in balancing sometimes conflicting sources of information. Figure 15 gives some indication of this effect – in particular in the downwards revisions introduced to the depth of the economic downturn in 2009. Figure 16 analyses this effect further by examining the profile of quarter on same quarter a year earlier GDP growth since Quarter 1 (Jan to mar) 2008 through recent Blue Book vintages. It shows that early estimates of GDP growth at the start of the economic downturn were subsequently revised down, and that the later estimates of the strength of the recovery have tended more often than not to be gradually revised up. In particular, GDP growth in 2011 and 2012 has been revised up in successive Blue Books. Both the direction and size of these revisions suggest that measurement is more difficult around economic turning points.
Figure 16: GDP growth during the economic downturn, quarter on same quarter a year earlier, multiple Blue Book vintages, %
Source: Office for National Statistics
Notes:
- Each line shows the estimates of quarter on same quarter a year earlier real GDP growth, published in the Quarterly National Accounts that was consistent with the respective Blue Book.
Download this chart Figure 16: GDP growth during the economic downturn, quarter on same quarter a year earlier, multiple Blue Book vintages, %
Image .csv .xls12. Productivity
The revisions to GDP – in particular during the recent economic recovery – also have implications for the level of productivity in current prices terms, but do little to affect the scale of the ‘productivity puzzle’ in volume terms. The recent weakness of real output per hour growth – both in the UK and in other developed economies – is one of the defining features of the recent recovery. For much of the recovery, the profile of productivity growth is broadly unchanged (Figure 17). On a Blue Book 2016 basis, output per hour fell by 2.9% from Quarter 1 (Jan to Mar) 2008 to Quarter 1 (Jan to Mar) 2009, compared with a previously published fall of 2.5%, however, it still recovered to its pre-downturn peak by Quarter 2 (Apr to June) 2011.
Figure 17: Output per hour relative to trend: previously published compared with indicative Blue Book 2016, Quarter 1 2008=100
Chained volume measure, seasonally adjusted
Source: Office for National Statistics
Notes:
- Note that these estimates of Blue Book 2016 consistent productivity are indicative: A complete set of Blue Book 2016 consistent labour productivity data will be published on 8 July 2016.
- The trend rate is calculated by taking a compound average growth rate of both series between Quarter 1 (Jan to Mar) 1997 and Quarter 4 (Oct to Dec) 2007. This is then applied to both series from Quarter 1 (Jan to Mar) 2008 onwards.
Download this chart Figure 17: Output per hour relative to trend: previously published compared with indicative Blue Book 2016, Quarter 1 2008=100
Image .csv .xlsProductivity on a Blue Book 2016 basis was 12.8% below its pre-downturn trend (based on an extrapolation of average quarterly growth in productivity in the decade between 1997 and 2007) in Q4 2014, compared with 13.0% below on a comparable, previously-published basis. The relatively small changes to the profile of productivity since 2008 mean that output per hour growth during the recovery remains weak. Productivity is estimated to have grown at a compound average growth rate of 0.1% per quarter during the recovery between 2009 and 2014. This near-flat productivity growth is a phenomenon unprecedented in the UK since the Second World War. According to the latest estimates, productivity had surpassed pre-downturn levels by 0.3% at the end of 2014. However, at the same stages of both the 1990s and 1980s recoveries, productivity was more than 16% above the respective pre-downturn levels (Figure 18).
Figure 18: Comparison of output per hour following pre-downturn peaks: previously published compared with indicative Blue Book 2016
Chained volume measure, seasonally adjusted
Source: Office for National Statistics
Notes:
- Estimates of Blue Book 2016 consistent productivity are indicative: A complete set of Blue Book 2016 consistent labour productivity data will be published on 8 July 2016.
Download this chart Figure 18: Comparison of output per hour following pre-downturn peaks: previously published compared with indicative Blue Book 2016
Image .csv .xls13. Impact articles published
14. Publication schedule for Blue Book and Pink Book 2016
| Date of publication | Content of article |
|---|---|
| Tuesday 7 June | Detailed assessment of changes to Sector and Financial Accounts, 1997 to 2014 |
| Tuesday 7 June | Detailed assessment of changes to Balance of Payments, 1997 to 2014 |
| Thursday 30 June | Quarterly National Accounts Quarter 1 (January to March) 2016 (consistent with Blue Book 2016) |
| Thursday 30 June | Balance of Payments Quarter 1 (January to March) 2016 (consistent with Pink Book 2016) |
| Thursday 30 June | Impact of changes in the National Accounts and economic commentary for Quarter 1 (January to March) 2016 |
| Friday 29 July | Blue Book 2016 |
| Friday 29 July | Pink Book 2016 |