1. What is informal adult care?
In the Household Satellite Account (HHSA), informal adult care estimates value the care received either from members of one’s own household, or from members of other households. Arguably, most of this care could be delegated to another person. Therefore, this informal care is deemed to be part of the productive role of households, and measured as part of home production.
Informal adult care is estimated using information on the number of adults (individuals aged 16 and over) receiving informal care in the UK. An adjustment is made for the type and regularity of the care given for it to be relevant to the HHSA. The 3 different types of adult care are: personal care, practical care and personal and practical care.
Personal care includes help with activities such as dressing, bathing, washing and feeding.
Practical care includes help with activities such as mobility (for example, getting out of bed) and paperwork or financial matters.
Personal and practical care is providing aspects of both of these.
The amount of care received varies from a visit once a week to continuous care. Once the frequency of care is assigned, a value of the number of hours of care received is applied to each case allowing the calculation of UK total hours of care. Finally, a suitable hourly wage rate is applied based on the closest market equivalent occupation. A full account of the methodology is located in the annex.
It should be noted that these measures of informal adult care do not aim to measure the help provided by members of voluntary organisations or care for individuals aged under 16 as this will be recorded in the volunteering and childcare sections of the HHSA.
Back to table of contents2. Volume of informal adult care
The volume of adult care is sourced from the Family Resources Survey which is a financial year dataset. To ensure comparability with the rest of the HHSA, financial year information is assumed to be equivalent to calendar year information. For instance, the number of hours of informal adult care reported in 2007 is equal to information for financial year ending 2008. Further, the latest year for which information is available is financial year ending 2013. Hours of informal adult care in 2014 are imputed assuming constant hours of care per person in the UK between 2013 and 2014.
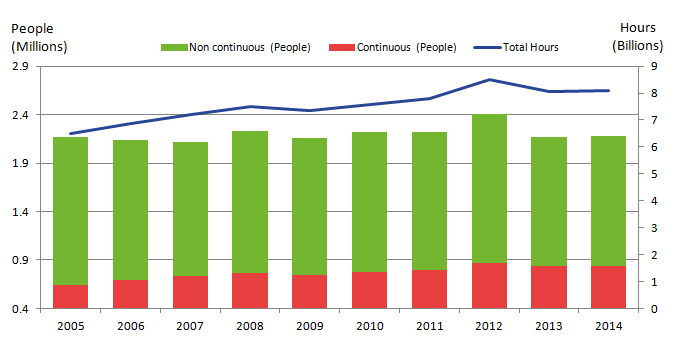
Figure 3.1: Total number of people receiving informal adult care by type, and total number of hours, 2005 to 2014
UK
Source: Family Resources Survey (FRS)
Download this image Figure 3.1: Total number of people receiving informal adult care by type, and total number of hours, 2005 to 2014
.png (16.1 kB) .xls (26.6 kB)
Figure 3.1 shows the number of adults receiving informal care remained largely static between 2005 and 2014, growing by 0.6%. In comparison, the total number of hours of care grew by 24.9% over the same period. The main contributor to this was the increasing proportion of those receiving continuous care (defined as receiving 168 hours per week). As figure 3.1 shows, since 2005 the number of people receiving continuous care has increased by 194,000. In comparison the amount of people receiving non-continuous care has fallen by 180,000 since 2005. As a result, continuous care hours increased by 1.7 billion compared with non-continuous care hours which fell by 0.1 billion between 2005 and 2014.
Figure 3.2: Frequency of informal adult care, 2005 and 2014
UK
Source: Family Resources Survey (FRS)
Download this chart Figure 3.2: Frequency of informal adult care, 2005 and 2014
Image .csv .xlsFigure 3.2 further highlights the changing pattern of frequency of informal care. In 2014, the proportion of continuous care received increased by 8.7 percentage points compared with that of 2005. Similarly in 2014, the proportion attributed to care received several times a day also increased whilst the proportion for once or twice a day and several times a week fell. This shift towards more frequent care explains the increasing total hours of adult care whilst the number of adults receiving care has stayed broadly flat.
Figure 3.3: Share of informal adult care by age, 2005 to 2014
UK
Source: Family Resources Survey (FRS)
Notes:
- Figures may not sum due to rounding
Download this chart Figure 3.3: Share of informal adult care by age, 2005 to 2014
Image .csv .xlsFigure 3.3 decomposes informal adult care by total hours received by age group. In 2014, those aged 70 and over, and those aged 50 to 69 received the most care, with 35.3% and 32.3% of the total informal adult care hours respectively. The remaining hours were received by those aged 30 to 49 (18.2%) and 16 to 29 (14.1%). Interestingly, those aged 70 and over have seen their share of total care decrease between 2005 and 2014. This is despite the fact that the population of this age group grew by 35.7% over the period, compared with 27.6% for the population as a whole.
Back to table of contents3. Gross value added of informal adult care
The output of informal adult care in the UK is estimated by multiplying the total hours of care by the wage rates of carers/nursing assistants. Gross value added (GVA), as described in the methodology section, is estimated by making an adjustment for the input of household housing services.
The GVA of informal adult care in the UK increased by 45.8% between 2005 and 2014, from £39.0 billion to £56.9 billion (Figure 3.4). This was characterised by 9.5% average annual growth between 2005 and 2008, driven by both a 15.7% increase in the total number of hours cared for, and an 11.9% increase in the wages of carers. Since 2008, growth has been relatively stable, with the exception of 2012 when value added grew by 11.2%. This was driven by an increase of 9.0% in the number of hours people reported being cared for.
Figure 3.4: GVA of informal adult care and GVA relative to GDP, 2005 to 2014
UK
Source: Office for National Statistics
Download this chart Figure 3.4: GVA of informal adult care and GVA relative to GDP, 2005 to 2014
Image .csv .xlsFigure 3.5 presents the output of informal care by age group. It shows that in 2014 those aged over 70 accounted for the largest proportion (35.5%) of the total output of informal adult care. However, the share of total informal adult care accounted for by those aged over 70 has declined by 5.9 percentage points from a peak of 41.4% in 2008. The proportion of total output accounted for by those aged 16 to 29, on the other hand, has almost doubled, growing from 7.4% to 14.0% of the total between 2007 and 2014.
Figure 3.5: Share of informal adult care output by age group, 2005 to 2014
UK
Source: Office for National Statistics
Notes:
- Figures may not sum due to rounding