Cynnwys
- Main points
- Things you need to know about this release
- The total UK trade deficit widened by £3.8 billion to £10.8 billion in the three months to December 2017
- The widening of the trade in goods deficit was mainly due to increases in imports from non-EU countries, alongside decreases in exports to the EU, in the three months to December 2017
- The UK’s top 10 trade in goods export markets in 2017 remained similar to 2016
- Large increases in fuels import prices combined with decreases in fuels export volumes had the largest impact on the widening of the trade in goods deficit, in the three months to December 2017
- The total UK trade deficit widened by £1.2 billion between November 2017 and December 2017
- What are the revisions to trade values since our last release?
- Links to related statistics
- Quality and methodology
1. Main points
The total UK trade (goods and services) deficit widened by £3.8 billion to £10.8 billion in the three months to December 2017; excluding erratic commodities, the deficit widened by £1.5 billion to £9.0 billion.
The £3.8 billion widening of the total trade (goods and services) deficit was due to a £3.3 billion widening of the trade in goods deficit and a £0.5 billion narrowing of the trade in services surplus; the trade deficit in fuels (oil) had the largest impact on the widening of the trade in goods deficit.
The widening of the trade in goods deficit was due mainly to a 3.8% (£2.1 billion) increase in imports from non-EU countries, alongside decreases in exports to the EU, in the three months to December 2017.
Large increases in fuels import prices along with decreases in fuels export volumes had the largest impact on the widening of the trade in goods deficit in the three months to December 2017.
Between November 2017 and December 2017, the UK total trade (goods and services) deficit widened by £1.2 billion, due primarily to an increase in goods imports including fuels (oil) from EU countries.
Comparing the three months to December 2017 with the same period in 2016, the UK total trade (goods and services) deficit widened by £3.8 billion; this was due primarily to increases of 7.5% (£8.7 billion) and 4.6% (£1.9 billion) in goods and services imports respectively.
Revisions to the total trade balance (goods and services) are mainly downward from January 2017 to November 2017, due mostly to downward revisions to goods and services exports alongside upward revisions to services imports.
2. Things you need to know about this release
Unless otherwise stated, all trade values discussed in this release are in current prices. The time series dataset also includes chained volume measures (series for which the effects of inflation have been removed) and these are indexed to form the volume series presented in the publication tables.
Data are supplied by over 30 sources, including several administrative sources; HM Revenue and Customs (HMRC) covering trade in goods is the largest. For trade in services, data are less timely than trade in goods estimates and are sourced mainly from survey data and a variety of administrative sources. The services data are processed quarterly, so monthly forecasts are made to provide a complete trade total. The most recent monthly data can therefore be considered more uncertain.
Trade statistics for any one month can be erratic. For that reason, we recommend comparing the latest three months against the preceding three months and the same three months of the previous year.
Oil and other “erratic” commodities can make a large contribution to trade in goods, but often mask the underlying trend in the export or import values due to their volatility. The “erratics” series includes ships, aircraft, precious stones, silver and non-monetary gold. Non-monetary gold can have a particularly large impact on growth rates, due to the large volumes of gold traded on the London markets. Therefore, we also publish data exclusive of these commodities, which may provide a better guide to the emerging trade picture.
In accordance with the National Accounts Revisions Policy, data in this release have been revised from January 2017 to November 2017 for both trade in goods and services.
The UK Statistics Authority suspended the National Statistics designation of UK trade on 14 November 2014. We have now responded to all of the specific requirements of the reassessment of UK trade and are in the final stages of providing evidence to the Authority. We are undertaking a programme of improvements to UK trade statistics in line with the UK trade development plan that will also address anticipated future demands. While delivering against this plan, we will continue to work with the Office for Statistics Regulation team to regain National Statistics status for UK trade statistics. We welcome feedback on this development plan.
Nôl i'r tabl cynnwys3. The total UK trade deficit widened by £3.8 billion to £10.8 billion in the three months to December 2017
The total trade (goods and services) deficit widened by £3.8 billion to £10.8 billion in the three months to December 2017 (Figure 1). This was due primarily to the widening of the trade in goods deficit by £3.3 billion to £37.2 billion, which resulted from a 2.9% (£3.5 billion) increase in goods imports to £123.9 billion, more than offsetting the 0.2% (£0.3 billion) increase in goods and services exports.
The trade deficit in fuels, which widened by £2.4 billion to £4.7 billion, had the largest impact on the trade in goods deficit, followed by a £1.9 billion widening of the unspecified goods deficit to £1.8 billion. Imports of unspecified goods (including non-monetary gold) and fuels were the largest contributors to the increase in goods imports, increasing by 74% (£2.1 billion) and 14.1% (£1.6 billion) respectively. Of fuels, oil was the largest import, increasing by 14.4% (£1.2 billion) – particularly refined oil (19.3%; £0.8 billion).
Trade in services also had some contribution to the widening of the total trade deficit in the three months to December 2017: the trade surplus in services narrowed by £0.5 billion to £26.4 billion, due to a larger increase in imports than exports; 1.3% (£0.5 billion) and 0.1% (£44 million) respectively. The increase in imports was due primarily to travel services and other business services.
When erratic commodities are excluded, the UK trade deficit widened by £1.5 billion to £9.0 billion in the three months to December 2017. The widening was due mainly to trade in goods imports increasing 0.9% (£1.0 billion) to £116.3 billion, combined with a 1.3% (£0.5 billion) increase in services imports). Given the small increase in total exports, 0.1% (£91 million) to £150.2 billion, the increase in total imports was larger thus the trade deficit excluding erratic commodities widened.
The main commodity contributor to the increase in imports excluding erratic commodities was fuels (particularly refined oil), which increased 14.1% (£1.6 billion), alongside smaller decreases to imports of other goods commodities.
Over the last year, the UK’s total trade deficit widened by £3.8 billion between the three months to December 2016 and the three months to December 2017. This was due primarily to increases of 7.5% (£8.7 billion) and 4.6% (£1.9 billion) in goods and services imports respectively. Imports of unspecified goods and fuels increased the most, by £2.9 billion and £2.3 billion respectively. Although total exports increased by a combined 4.5% (£6.7 billion), these increases were offset by the larger increases in goods (and services) imports.
Figure 1: Three-month on three-month UK trade balances, June 2013 to December 2017
Source: Office for National Statistics
Download this chart Figure 1: Three-month on three-month UK trade balances, June 2013 to December 2017
Image .csv .xls4. The widening of the trade in goods deficit was mainly due to increases in imports from non-EU countries, alongside decreases in exports to the EU, in the three months to December 2017
The UK trade in goods deficit widened by £3.3 billion to £37.2 billion in the three months to December 2017. This was due primarily to a 2.9% (£3.5 billion) increase in goods imports to £123.9 billion, which offset much smaller increases, of 0.3% (£0.3 billion), in goods exports to £86.7 billion.
Figure 2 and 3 show the contribution of goods exports and imports to EU and non-EU countries respectively in the three months to December 2017.
The increase in goods imports came mainly from non-EU countries, which increased 3.8% (£2.1 billion) to £56.6 billion, while non-EU exports increased 1.5% (£0.7 billion) to £44.1 billion in the three months to December 2017. As imports increased by more than exports, the deficit with non-EU countries widened by £1.4 billion to £12.5 billion. This follows a £1.7 billion widening of the deficit in the three months to September 2017, when exports decreased as imports increased.
The increase in imports from non-EU countries was due to a 61.3% (£1.6 billion) increase in unspecified goods (including non-monetary gold) and an 11.2% (£0.9 billion) increase in fuels, particularly refined oil, which increased by 24.4% (£0.6 billion).
Imports from the EU increased 2.2% (£1.5 billion), due mainly to a 23.5% (£0.6 billion) increase in fuels, particularly refined oil (13.3%; £0.3 billion). While exports to EU countries increased for certain goods, notably mechanical machinery (£0.7 billion), the decrease in other export commodities, especially fuels (£0.6 billion), mainly crude oil (£0.5 billion) and chemicals (£0.2 billion), more than offset increases in exports. Exports to other EU countries therefore fell by 0.9% (£0.4 billion) to £42.7 billion. The combined effect of rising imports and falling exports, meant that the deficit with EU countries widened by £1.9 billion to £24.7 billion. This follows three consecutive three-month periods when the deficit narrowed.
Figure 2: Contribution of goods exports to total EU and non-EU exports, three-months to December 2017 on previous three-months to September 2017
Source: Office for National Statistics
Download this chart Figure 2: Contribution of goods exports to total EU and non-EU exports, three-months to December 2017 on previous three-months to September 2017
Image .csv .xls
Figure 3: Contribution of goods imports to total EU and non-EU imports, three-months to December 2017 on previous three-months to September 2017
Source: Office for National Statistics
Download this chart Figure 3: Contribution of goods imports to total EU and non-EU imports, three-months to December 2017 on previous three-months to September 2017
Image .csv .xlsWhen excluding erratic commodities, the latest three-month balance patterns are unchanged for both the non-EU and EU trade in goods deficits1. The non-EU trade deficit widened by £0.2 billion to £10.1 billion, while the EU deficit widened by £0.8 billion to £25.3 billion in the three months to December 2017.
Notes for: The widening of the trade in goods deficit was due mainly to increases in imports from non-EU countries, alongside decreases in exports to the EU
- Data can be found using series identifiers SDCR and SDED in the MRET time series dataset
5. The UK’s top 10 trade in goods export markets in 2017 remained similar to 2016
Figures 4 and 5 show the UK trade in goods top 10 export and import, respectively, markets in 2017. Overall the UK’s top nine trade in goods export markets in 2017 remained similar to 2016, with the United States (with Puerto Rico) (£48.9 billion), Germany (£37.7 billion), France (£25.9 billion), the Netherlands (£21.3 billion) and Ireland (£19.6 billion) in the top five. Switzerland has been replaced by Hong Kong in 10th position in 2017 (12th place in 2016). Amongst the top 10 countries, exports to France and China increased the most, £5.9 billion and £4.7 billion respectively, from 2016 to 2017.
Figure 4: UK trade in goods top 10 export markets in 2017
Source: Office for National Statistics
Download this chart Figure 4: UK trade in goods top 10 export markets in 2017
Image .csv .xlsThe top 10 countries for UK imports of goods remained the same but the ranking position of some countries changed on the 2017 hierarchy in comparison with 2016. Germany (£69.5 billion) and China (£43.7 billion) remained the top two countries for UK imports of goods in 2017. Amongst the top 10 countries, imports from Norway and the Netherlands increased the most, £6.1 billion and £4.8 billion respectively, from 2016 to 2017.
When analysing these figures users should consider the “Rotterdam effect”, where goods initially exported to one country are subsequently re-exported to another country. Therefore, trade in goods with the Netherlands might be artificially inflated by those goods dispatched from or arriving in Rotterdam despite the ultimate destination or country of origin being located elsewhere. This might overstate the share of exports to and imports from the Netherlands.
We have previously published an article explaining the impact of the Rotterdam effect on UK Trade, which explored the difficulty of quantifying, with any certainty, the impact that the Rotterdam effect has on UK trade with the Netherlands and its subsequent impact on UK trade with EU and non-EU countries.
Figure 5: UK trade in goods top 10 import countries in 2017
Source: Office for National Statistics
Download this chart Figure 5: UK trade in goods top 10 import countries in 2017
Image .csv .xls6. Large increases in fuels import prices combined with decreases in fuels export volumes had the largest impact on the widening of the trade in goods deficit, in the three months to December 2017
Figures 6 and 7 show the three-month on three-month UK goods export and import values, volumes and prices respectively from June 2013 to December 2017.
The £3.5 billion increase in the value of total goods imports to £123.9 billion in the three months to December 2017 was due mainly to volume increases. Total goods import volumes increased 1.7% in the three months to December 2017, which is the fourth and largest consecutive three-month increase in import volumes; this followed a 1.5% decrease in import volumes in the three months to December 2016.
The value increase in fuels imports was due largely to price movements, as fuels import prices increased by 14.2% while fuels import volumes increased by 0.3%. Total import prices increased by 1.0%, however, when excluding oil, import prices decreased by 0.2%.
The £0.3 billion increase in the value of total goods exports to £86.7 billion in the three months to December 2017 was due primarily to price increases. Total export prices increased by 1.0% while export volumes fell by 0.6%. The 21.6% decrease in export volumes of fuels (mainly oil) had a large impact on the fall in export volumes. When excluding oil export volumes increased by 1.3%.
The combined effect of increased import volumes as export volumes decreased, while both prices rose 1.0%, was a £3.3 billion widening of the trade in goods deficit to £37.2 billion. This coincides with an increase in the value of sterling in the three months to December 2017.
While simple economic theory suggests an increase in the value of sterling should result in an increase in export prices (exports decreasing in competitiveness) and a decrease in import prices, in practice the impact of a sterling change is likely to be much more complex. Our Economic review has detailed the economic theory of the expected impact of sterling exchange rate movements on export and import volumes and prices.
Although the increase in import prices may appear contrary to economic theory, while increases in export prices are in line with economic theory, it is important to note that prices are reported in sterling for the UK rather than foreign currency terms. As detailed in the Economic review, changes in prices (on a sterling basis) are likely to be largely attributable to the amount of trade conducted on a foreign currency basis (with EU and non-EU countries) as price changes are lagged in the short-term – therefore, it is possible there may be no change in the price in foreign currency terms.
Figure 6: Three-month on three-month UK goods export values, volumes and prices, June 2013 to December 2017

Source: Office for National Statistics
Download this image Figure 6: Three-month on three-month UK goods export values, volumes and prices, June 2013 to December 2017
.png (43.9 kB) .xlsx (9.0 kB)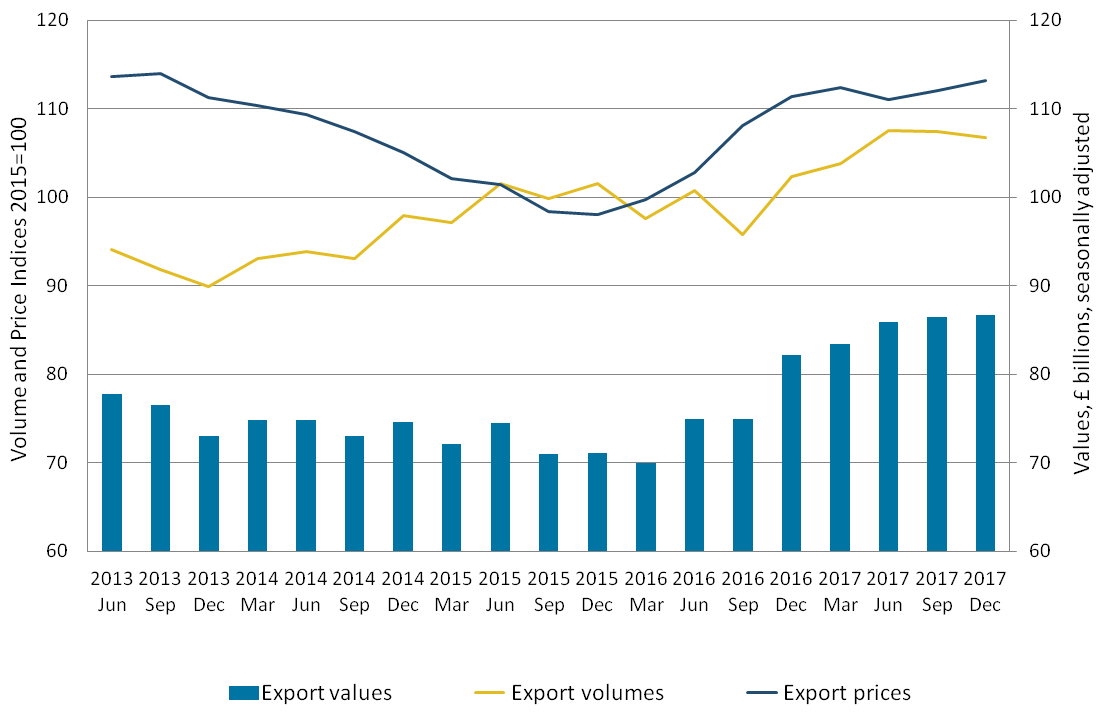
Figure 7: Three-month on three-month UK goods import values, volumes and prices, June 2013 to December 2017

Source: Office for National Statistics
Download this image Figure 7: Three-month on three-month UK goods import values, volumes and prices, June 2013 to December 2017
.png (48.5 kB) .xlsx (12.4 kB)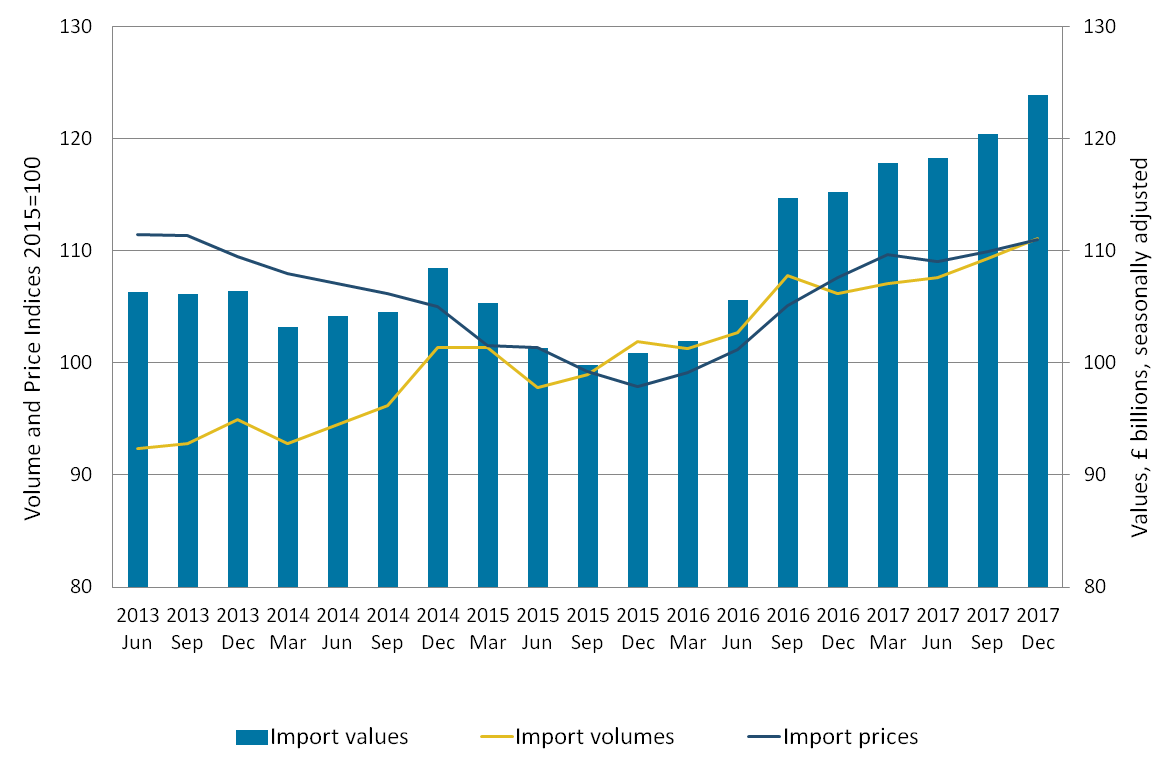
The volume of goods exported to and imported from non-EU countries increased 1.1% and 2.3% respectively, while non-EU export prices increased 0.3% and import prices increased 1.6%. When excluding oil, non-EU export and import prices both decreased 0.5%, which coincides with total fuels (mainly oil) export and import sterling prices increasing 15.7% and 14.2% respectively in the three months to December 2017.
The volume of goods exported to other EU countries decreased 2.5% and goods imported from the EU increased 1.2% in the three months to December 2017, while EU export and import prices increased 1.6% and 0.5% respectively. When excluding oil, EU export and import prices remained flat, which coincides with increases in total fuels (mainly oil) export and import sterling prices in the three months to December 2017.
The import value increase in fuels (mainly oil) from non-EU and EU countries, 11.2% (£0.9 billion) and 23.5% (£0.6 billion) respectively, had a large impact on the 2.9% (£3.5 billion) increase in total trade in goods import value. This was due mainly to a 14.2% increase in total fuels import prices while import volumes were flat.
When excluding oil, export volumes to non-EU countries increased by 2.8%, while export volumes to the EU decreased by 0.4%, which coincides with the 21.6% decrease in total fuels (mainly oil) export volumes in the three months to December 2017.
As a result of the larger import volumes from non-EU and EU countries alongside decreases in EU export volumes, these movements had a large contribution to the total trade in goods deficit widening (by £3.3 billion to £37.2 billion).
Nôl i'r tabl cynnwys7. The total UK trade deficit widened by £1.2 billion between November 2017 and December 2017
The total trade (goods and services) deficit widened by £1.2 billion to £4.9 billion between November 2017 and December 2017. This is due primarily to trade in goods imports increasing 3.8% (£1.6 billion) to £42.6 billion. The increase in trade in goods imports was mainly a result of unspecified goods imports (£1.3 billion) including non-monetary gold and fuels (£0.3 billion), from non-EU and EU countries respectively.
Excluding erratic commodities, the total trade deficit narrowed by £77 million to £3.3 billion between November 2017 and December 2017. This was due mainly to a 1.8% (£0.5 billion) increase in goods exports to £27.3 billion, which was larger than total goods and services imports (£0.4 billion). The main contributor to the increase in exports was a 3.7% (£0.4 billion) increase in machinery and transport equipment and 7.8% (£0.3 billion) increase in chemicals exports, to EU and non-EU countries respectively.
Nôl i'r tabl cynnwys8. What are the revisions to trade values since our last release?
In accordance with the National Accounts Revisions Policy, trade in goods and services data in this release have been revised from January 2017 to November 2017 (Figure 8).
Revisions to the total trade balance (goods and services) are relatively small and downward (widening of the deficit) from January 2017 to June 2017, although July to November 2017 saw larger revisions with the largest downward revision occurring in November (£0.8 billion). This was due primarily to £0.4 billion downward revisions to services exports alongside £0.2 billion upward revisions to services imports, while goods exports were revised down by £0.5 billion (goods imports were revised down by £0.3 billion).
The trade in services revisions are consistently downward each month over the period, due mainly to downward revisions to services exports alongside upward revisions to services imports. Revisions to services are due mainly to updates to the annual benchmarking of legal services data.
Trade in goods revisions over the same period are due mainly to larger downward revisions to exports (particularly finished manufacture exports) in comparison with downward revisions to imports (mainly miscellaneous manufacture and chemicals imports).
Figure 8: Revisions to UK trade balances, January 2017 to November 2017
Source: Office for National Statistics
Download this chart Figure 8: Revisions to UK trade balances, January 2017 to November 2017
Image .csv .xls10. Quality and methodology
Trade is measured through both imports and exports of goods and/or services. Data are supplied by over 30 sources including several administrative sources, HM Revenue and Customs (HMRC) being the largest.
This monthly release contains tables showing the total value of trade in goods together with index numbers of volume and price. Figures are analysed by broad commodity group (values and indices) and according to geographical area (values only). In addition, the UK trade statistical bulletin also includes early monthly estimates of the value of trade in services.
Further qualitative data and information can be found in the attached datasets. This includes data on:
Detailed methodological notes are published in the UK Balance of Payments, The Pink Book 2017.
The UK trade methodology web pages have been developed to provide detailed information about the methods used to produce UK trade statistics.
The UK trade Quality and Methodology Information report contains important information on:
the strengths and limitations of the data and how it compares with related data
uses and users of the data
how the output was created
the quality of the output including the accuracy of the data