Cynnwys
- Main points
- Things you need to know about this release
- Falling exports of goods and services led to a widening of the total trade deficit in the three months to April 2018
- The UK’s trade in goods deficit improved with countries outside of the EU and worsened with countries inside the EU in the three months to April 2018
- Falling volumes was the main reason for the declines in exports of machinery, pharmaceuticals and aircraft in the three months to April 2018
- An improvement to the trade in services surplus led to a narrowing of the total trade deficit in the 12 months to April 2018
- Revisions
- Links to related statistics
- Quality and methodology
1. Main points
The total UK trade deficit widened £1.9 billion to £9.7 billion in the three months to April 2018, due mainly to falling exports of both goods and services.
Goods exports fell £3.1 billion, due mainly to falls in exports of machinery, pharmaceuticals and aircraft, while services exports also fell £2.5 billion in the three months to April 2018.
Falling volumes was the main reason for the declines in exports of machinery, pharmaceuticals and aircraft in the three months to April 2018 as price movements were relatively small.
The UK’s trade in goods deficit improved £0.6 billion with countries outside of the EU and worsened £1.2 billion with countries inside the EU in the three months to April 2018.
A £9.9 billion improvement to the services trade surplus, due to a rise of 8.3% for services exports, meant the total trade deficit narrowed £6.7 billion in the 12 months to April 2018.
Revisions resulted in an upward £0.3 billion net contribution to the total trade balance in January 2018 and downward contributions of £22 million and £0.1 billion in February and March 2018 respectively.
2. Things you need to know about this release
Improvements we are introducing in June and July 2018
We have embarked upon and are delivering against an ambitious UK trade development plan, which is providing users with better explained and more detailed statistics. We have developed new IT systems for trade in goods and services that will be used to deliver UK National Accounts, The Blue Book and UK Balance of Payments, The Pink Book 2018 to help us deliver against objectives set out in Section 4.2 of the plan.
On 29 June 2018, we will publish improved trade figures in quarterly gross domestic product (GDP), sector and financial accounts (SFA) and balance of payments (BoP), consistent with Blue Book and Pink Book 2018. For more information see National Accounts articles: UK trade data impact assessment from new developments, 1997 to 2016. These improvements will be included in figures published in the monthly UK trade bulletin from 10 July 2018 onwards.
From 10 July 2018 onwards, we will also publish country-by-commodity import and export data each month alongside the trade bulletin. For more information on country-by-commodity statistics, including an experimental cut of the data, please see Trade in goods, country-by-commodity experimental data: 2011 to 2016.
Volume and price indices will also be replaced with chained volume measures (CVMs) and implied deflators (current price divided by CVM) from 10 July. You should note that this will introduce changes to the layout of Tables 3, 5, 6, 9 and 10 in the publication tables dataset.
International Passenger Survey
Estimates derived from the International Passenger Survey (IPS) are used to help measure imports and exports of travel services. The IPS is in the process of transferring data collection from paper forms to tablet computers. Initial analysis of the new data suggests there may be discontinuities arising from the change in mode of collection. These new data will not be used in estimates of trade in travel services, in headline trade or other national accounts estimates until we have produced a consistent time series on the new basis.
Measurement of trade data
Unless otherwise stated, all trade values discussed in this release are in current prices (without the effect of inflation removed). The time series dataset also includes chained volume measures (series for which the effects of inflation have been removed) and these are indexed to form the volume series presented in the publication tables dataset.
Data sources
Data are supplied by over 30 sources, including several administrative sources; HM Revenue and Customs (HMRC) covering trade in goods is the largest. For trade in services, data are less timely than trade in goods estimates and are sourced mainly from survey data and a variety of administrative sources. The services data are processed quarterly, so monthly forecasts are made to provide a complete trade total. The most recent monthly data can therefore be considered more uncertain.
Erratic commodities
Trade statistics for any one month can be erratic. For that reason, we recommend comparing the latest three months against the preceding three months and the same three months of the previous year.
Oil and other “erratic” commodities can make a large contribution to trade in goods, but often mask the underlying trend in the export or import values due to their volatility. The “erratics” series includes ships, aircraft, precious stones, silver and non-monetary gold. Non-monetary gold can have a particularly large impact on growth rates, due to the large volumes of gold traded on the London markets. Therefore, we also publish data exclusive of these commodities, which may provide a better guide to the emerging trade picture.
Data revision policy
In accordance with the National Accounts Revisions Policy, data in this release have been revised from January 2018 to March 2018 for both goods and services data.
National Statistics designation status
The UK Statistics Authority suspended the National Statistics designation of UK trade on 14 November 2014. We have now responded to all of the specific requirements of the reassessment of UK trade and are in the final stages of providing evidence to the Authority. We are undertaking a programme of improvements to UK trade statistics in line with the UK trade development plan that will also address anticipated future demands. While delivering against this plan, we will continue to work with the Office for Statistics Regulation team to regain National Statistics status for UK trade statistics. We welcome feedback on this development plan.
Nôl i'r tabl cynnwys3. Falling exports of goods and services led to a widening of the total trade deficit in the three months to April 2018
Figure 1 shows three-month on three-month trade balances for the period October 2013 to April 2018.
The total UK trade deficit (goods and services) widened £1.9 billion to £9.7 billion in the three months to April 2018. This follows a £0.9 billion narrowing of the deficit in the three months to March 2018.
The trade balance for both goods and services deteriorated in the three months to April 2018; the trade in services surplus narrowed £1.3 billion to £26.5 billion and the trade in goods deficit widened £0.6 billion to £36.2 billion.
Exports of both goods and services fell by a larger amount than respective imports in the three months to April 2018; services exports fell £2.5 billion compared with a fall of £1.2 billion for services imports, while goods exports fell £3.1 billion compared with a fall of £2.5 billion for goods imports.
Excluding erratic commodities, the total trade deficit widened £2.0 billion to £9.9 billion in the three months to April 2018.
Figure 1: UK trade balances, three-month on three-month, October 2013 to April 2018
Source: Office for National Statistics
Download this chart Figure 1: UK trade balances, three-month on three-month, October 2013 to April 2018
Image .csv .xls4. The UK’s trade in goods deficit improved with countries outside of the EU and worsened with countries inside the EU in the three months to April 2018
Figures 2 and 3 show the contribution of commodities to total EU and non-EU exports and imports for the three months to April 2018.
The UK’s trade in goods balance with countries outside of the EU improved by £0.6 billion in the three months to April 2018 due to imports falling by more than exports; imports fell £2.5 billion (Figure 3) compared with a fall of £1.9 billion for exports (Figure 2).
The largest declines in commodity imports from countries outside of the EU were £2.0 billion in imports of machinery and transport equipment (mainly aircraft and mechanical machinery) and £0.9 billion of miscellaneous goods.
The UK’s trade in goods balance with EU countries worsened by £1.2 billion in the three months to April 2018 due to exports falling by more than imports; while exports fell £1.3 billion (Figure 2), imports were relatively flat, falling just £58 million (Figure 3).
The largest declines in commodity exports to EU countries included £0.5 billion of chemicals (mainly pharmaceuticals), £0.3 billion of fuels (mainly oil) and £0.3 billion of machinery and transport equipment (mainly mechanical machinery).
Figure 2: Contribution by commodity to EU and non-EU goods exports, three months to April 2018 on previous three months to January 2018
Source: Office for National Statistics
Download this chart Figure 2: Contribution by commodity to EU and non-EU goods exports, three months to April 2018 on previous three months to January 2018
Image .csv .xls
Figure 3: Contribution by commodity to EU and non-EU goods imports, three months to April 2018 on previous three months to January 2018
Source: Office for National Statistics
Download this chart Figure 3: Contribution by commodity to EU and non-EU goods imports, three months to April 2018 on previous three months to January 2018
Image .csv .xls5. Falling volumes was the main reason for the declines in exports of machinery, pharmaceuticals and aircraft in the three months to April 2018
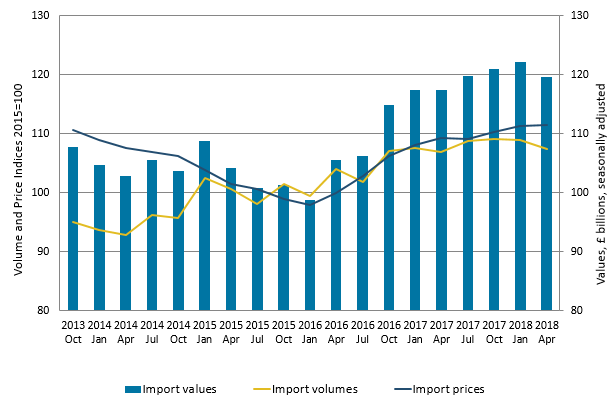
Figures 4 and 5 show the three-month on three-month UK goods export and import values, volumes and prices for the period October 2013 to April 2018.
The total value of goods exported to, and imported from, the UK fell 3.6% and 2.1% respectively in the three months to April 2018. The declines were driven predominately by falling volumes as prices for exports and imports showed relatively small movements; export volumes declined 2.9% versus export prices, which fell 0.3% (Figure 4), while import volumes fell 1.4% compared with an increase of 0.1% for import prices (Figure 5).
In terms of recent trends, goods export volumes went through a period of growth between the three months to October 2016 and the three months to October 2017, however, volumes have fallen 5.4% since October 2017 (Figure 4); imports also fell across this period, but by a lesser 1.5% (Figure 5).
Figure 4: UK goods export values, volumes and prices, three-month on three-month, October 2013 to April 2018

Source: Office for National Statistics
Download this image Figure 4: UK goods export values, volumes and prices, three-month on three-month, October 2013 to April 2018
.PNG (30.9 kB) .xlsx (19.1 kB)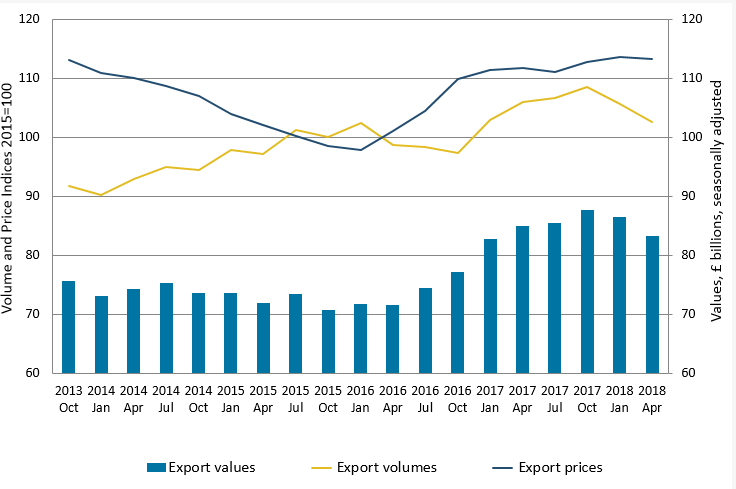
Figure 5: UK goods import values, volumes and prices, three-month on three-month, October 2013 to April 2018
Source: Office for National Statistics
Download this image Figure 5: UK goods import values, volumes and prices, three-month on three-month, October 2013 to April 2018
.PNG (31.2 kB) .xlsx (19.2 kB)
Figure 6 shows the percentage change to volumes for goods exports and imports by commodity group, for the three months to April 2018 compared with the previous three months to January 2018.
Apart from food, beverages and tobacco, export volumes fell across all commodity groups in the three months to April 2018. Volumes declined 4.1% for fuels, followed by 3.1% for semi-manufactures and 1.8% for finished-manufactures.
Figure 6: Percentage change to volumes for goods exports and imports by commodity group, three months to April 2018 compared with three months to January 2018
Source: Office for National Statistics
Download this chart Figure 6: Percentage change to volumes for goods exports and imports by commodity group, three months to April 2018 compared with three months to January 2018
Image .csv .xls6. An improvement to the trade in services surplus led to a narrowing of the total trade deficit in the 12 months to April 2018
Figure 7 shows 12-month on 12-month UK trade balances for the period April 2016 to April 2018.
The UK total trade deficit (goods and services) narrowed £6.7 billion to £30.8 billion in the 12 months to April 2018. An improvement to the trade in services balance was the main factor, as the trade surplus the UK has in services widened £9.9 billion to £108.7 billion. The trade in goods deficit worsened, widening £3.2 billion to £139.5 billion over the same period.
Services exports increased 7.5% (£19.8 billion) compared with services imports, which rose 6.0% (£9.9 billion). Goods exports rose 7.4% (£23.5 billion) compared with goods imports, which increased 5.9% (£26.7 billion).
Figure 7: 12-month on 12-month UK trade balances, April 2016 to April 2018
Source: Office for National Statistics
Download this chart Figure 7: 12-month on 12-month UK trade balances, April 2016 to April 2018
Image .csv .xls7. Revisions
In accordance with the National Accounts Revisions Policy, data in this release have been revised from January 2018 (Figure 8).
Revisions to data for January 2018 resulted in a upward net contribution of £0.3 billion to the total trade balance in January 2018 and downward net contributions of £22 million and £0.1 billion in February and March 2018 respectively.
Figure 8: Revisions to UK trade balances, January 2018 to March 2018
Source: Office for National Statistics
Download this chart Figure 8: Revisions to UK trade balances, January 2018 to March 2018
Image .csv .xls9. Quality and methodology
Trade is measured through both imports and exports of goods and/or services. Data are supplied by over 30 sources including several administrative sources, HM Revenue and Customs (HMRC) being the largest.
This monthly release contains tables showing the total value of trade in goods together with index numbers of volume and price. Figures are analysed by broad commodity group (values and indices) and according to geographical area (values only). In addition, the UK trade statistical bulletin also includes early monthly estimates of the value of trade in services.
Further qualitative data and information can be found in the attached datasets. This includes data on:
Detailed methodological notes are published in the UK Balance of Payments, The Pink Book 2017.
The UK trade methodology web pages have been developed to provide detailed information about the methods used to produce UK trade statistics.
The UK trade Quality and Methodology Information report contains important information on:
the strengths and limitations of the data and how it compares with related data
uses and users of the data
how the output was created
the quality of the output including the accuracy of the data