
1. Main points
The price of services sold by UK companies, as estimated by the Services Producer Price Index (SPPI), increased 1.4% in the year to Quarter 4 (Oct to Dec) of 2016, compared with an increase of 1.6% in the year to Quarter 3 (July to Sept) of 2016.
Between Quarters 3 and 4 of 2016, SPPI rose by 0.2%, unchanged from last quarter.
Information and communication activities showed the largest upward contribution to the annual rate; prices increased by 2.5% in the year to Quarter 4 of 2016.
Administrative and support services showed the only downward contribution to the annual rate, decreasing by 0.5% in the year to Quarter 4 of 2016.
2. Things you need to know about this release
The Services Producer Price Indices (SPPI) provides a measure of inflation for the UK service sector. It is constructed from a statutory quarterly survey, which measures changes in the price received for selected services provided by UK businesses to other UK businesses and government. Individual SPPIs are available, which provide information on price change for a selection of service industries. These individual price indices are also aggregated together to create a service industry SPPI with limited coverage (it does not provide full coverage of the “service sector”).
The primary use of the SPPI is as a deflator in the UK National Accounts. However, it is also important as an inflationary measure to inform monetary policy and to account for inflation in long-term service procurement contracts. For more information on the use made of SPPI please see the separate document Users of Services Producer Price Index data.
The figures presented in this statistical bulletin are considered provisional for the latest 2 quarters (Quarters 3 and 4 of 2016) and may be revised as late data is received.
None of the indices presented in this bulletin are seasonally adjusted.
Coverage of SPPI
The service sector is estimated to account for around 78% of the UK economy based on its weight in gross domestic product (GDP). We do not produce an index for every industry in the service sector and so the SPPI is a partial, best estimate, of the overall inflation to UK businesses in the service sector. The SPPIs presented in this statistical bulletin are estimated to represent 59% of the total service sector at industry level. The SPPI's coverage of the service sector at standard industrial classification (SIC) class, division and section level is available in the SPPI coverage document. As resources allow, we will continue to review the existing indices and expand coverage through developing indices for new industries. As such, the SPPI will change composition from time to time but will always remain our best estimate of inflation in the UK service sector. The fact that coverage may change over time should be considered when deciding which indices best meet your needs.
Nôl i'r tabl cynnwys3. Summary
Between early-2006 and mid-2008, the annual rate of inflation in the service sector, as estimated by the Services Producer Price Index (SPPI), rose steadily from an annual rate of 2.4% in Quarter 1 (Jan to Mar) of 2006 to a peak of 3.7% during Quarters 1 and 2 (Apr to June) of 2008. At the end of 2008, the rate of inflation fell rapidly, from annual inflation of 3.6% in Quarter 3 (July to Sept) of 2008 to deflation (prices lower than they were in the same quarter of the previous year) of 1.6% in Quarter 3 of 2009.
The annual rate of inflation began to move in an upward direction at the end of 2009, reaching a post-economic downturn high of 1.8% in Quarter 2 of 2010. In the year to Quarter 4 of 2016, prices increased by 1.4% (Figure 1).
Looking at the latest estimates (Table 1) of the SPPI for Quarter 4 of 2016, the main movements were:
- prices received by UK service providers increased 1.4% in the year to Quarter 4 of 2016, down from an increase of 1.6% in the year to Quarter 3 of 2016
- the main upward contributions to the annual rate came from increases in the prices charged for information and communication, and professional, scientific and technical activities
- services prices rose 0.2% between Quarters 3 and 4 of 2016, unchanged from the last quarter
- the main upward contributions to the quarterly rate of inflation came from transportation and storage, professional, scientific and technical activities, and repair and maintenance of motor vehicles
Table 1: Output prices (gross sector) - Services Producer Price Index1,2,3
| Quarter 2 (Apr to Jun) 2012 to Quarter 4 (Oct to Dec) 2016, UK | ||||
| Percentage change | ||||
| Year | Quarter | |||
|---|---|---|---|---|
| 2012 | Q2 | 0.8 | 0.5 | |
| Q3 | 1.5 | 0.2 | ||
| Q4 | 1.5 | 0.4 | ||
| 2013 | Q1 | 1.5 | 0.4 | |
| Q2 | 0.8 | -0.2 | ||
| Q3 | 0.8 | 0.2 | ||
| Q4 | 1.3 | 0.9 | ||
| 2014 | Q1 | 0.9 | 0.0 | |
| Q2 | 1.5 | 0.4 | ||
| Q3 | 1.5 | 0.2 | ||
| Q4 | 0.6 | 0.0 | ||
| 2015 | Q1 | 0.4 | -0.2 | |
| Q2 | 0.4 | 0.4 | ||
| Q3 | 0.3 | 0.1 | ||
| Q4 | 0.7 | 0.4 | ||
| 2016 | Q1 | 1.3 | 0.5 | |
| Q2 | 1.5 | 0.6 | ||
| Q3 | 1.6 | 0.2 | ||
| Q4 | 1.4 | 0.2 | ||
| Source: Services Producer Price Indicies (SPPI) - Office for National Statistics | ||||
| Notes: | ||||
| 1. The SPPI is calculated on a gross sector basis. | ||||
| 2. The SPPI is an aggregate of the individual industry level SPPIs (excluding Financial Intermediation) published in the SPPI Statistical Bulletin. It does not provide full coverage of the service sector. | ||||
| 3. Q1 refers to Quarter 1 (January to March), Q2 refers to Quarter 2 (April to June), Q3 refers to Quarter 3 (July to September) and Q4 refers to Quarter 4 (October to December). | ||||
Download this table Table 1: Output prices (gross sector) - Services Producer Price Index^1,2,3^
.xls (26.6 kB)
Figure 1: Services Producer Price Index1,2,3
Quarter 4 (Oct to Dec) 2006 to Quarter 4 (Oct to Dec) 2016, UK
Source: Services Producer Price Indices (SPPI) - Office for National Statistics
Notes:
- The SPPI is calculated on a gross sector basis.
- The SPPI is an aggregate of the individual industry level SPPIs (excluding financial intermediation) published in the SPPI statistical bulletin. It does not provide full coverage of the service sector.
- Q1 refers to Quarter 1 (January to March), Q2 refers to Quarter 2 (April to June), Q3 refers to Quarter 3 (July to September) and Q4 refers to Quarter 4 (October to December).
Download this chart Figure 1: Services Producer Price Index^1,2,3^
Image .csv .xls4. Annual inflation
The Services Producer Price Index (SPPI) rose by 1.4% in the year to Quarter 4 (Oct to Dec) of 2016, down from an increase of 1.6% in the year to Quarter 3 (Jul to Sep) of 2016. Of the 10 sections (as defined by the 2007 Standard Industrial Classification) that are combined to form the SPPI, 9 showed price increases.
The main upward contributions to the annual rate of the SPPI came from information and communication, and professional, scientific and technical activities. These increased 2.5% and 1.5% respectively, in the year to Quarter 4 of 2016, compared with increases of 2.7% and 1.9% respectively in the year to Quarter 3 of 2016. Transportation and storage activities also had a notable contribution to the increase of the index in the year to Quarter 4 of 2016, increasing by 1.1%, unchanged from last quarter.
The only section to show a decrease was administrative and support services where prices fell by 0.5% in the year to Quarter 4 of 2016, compared with an increase of 0.7% in the year to Quarter 3 of 2016 (Table 2 and Figure 2).
Table 2: Annual growth in Services Producer Price Index (percentage change, latest quarter on corresponding quarter of previous year)1
| Quarter 4 (Oct to Dec) 2016, UK | |
| Section | Annual percentage change |
|---|---|
| Water supply, sewerage and waste management | 3.1 |
| Repair and maintenance of motor vehicles | 2.0 |
| Transportation and storage | 1.1 |
| Accommodation and food | 1.6 |
| Information and communication | 2.5 |
| Real estate activities | 1.9 |
| Professional, scientific and technical activities | 1.5 |
| Administrative and support services | -0.5 |
| Education | 0.2 |
| Other services | 2.1 |
| SPPI | 1.4 |
| Source: Services Producer Price Indicies (SPPI) - Office for National Statistics | |
| Notes: | |
| 1. The section level SPPIs are an aggregate of individual industry level SPPIs (excluding Financial Intermediation) published in the SPPI Statistical Bulletin. They do not provide full coverage of the service sector. | |
Download this table Table 2: Annual growth in Services Producer Price Index (percentage change, latest quarter on corresponding quarter of previous year)^1^
.xls (25.1 kB)
Figure 2: Contribution to Services Producer Price Index annual growth rate1
Quarter 4 (Oct to Dec) 2016, UK
Source: Services Producer Price Indices (SPPI) - Office for National Statistics
Notes:
- The section level SPPIs are an aggregate of individual industry level SPPIs (excluding financial intermediation) published in the SPPI statistical bulletin. They do not provide full coverage of the service sector.
Download this chart Figure 2: Contribution to Services Producer Price Index annual growth rate^1^
Image .csv .xlsInformation and communication activities prices increased by 2.5% in the year to Quarter 4 of 2016. Prices rose in all indices within this section, but the largest contributions to the rise were seen in computer software and business telecoms. Computer software services increased 1.7% in the year to Quarter 4 of 2016, compared with an increase of 1.9% in the year to Quarter 3 of 2016. The increase was driven by an increase in the prices of facilities management, outsourcing and data processing. Business telecoms prices increased by 3.9% in the year to Quarter 4 of 2016, compared with an increase of 4.0% in the year to Quarter 3 of 2016.
Professional, scientific and technical activities prices increased 1.5% in the year to Quarter 4 of 2016. Increases in the prices of business and management consultancy services, accountancy services and legal services contributed towards this increase, with prices increasing 2.1%, 1.8% and 2.3% respectively in the year to Quarter 4 of 2016. The increase in the price for business and management consultancy services was due to a rise in the prices of human resources consultancy, the increase in accountancy services was due to a rise in the prices for tax consultancy and the increase for legal services resulted from price rises in legal advisory and representation for business and commercial law.
The prices for transportation and storage activities increased 1.1% in the year to Quarter 4 of 2016, unchanged from Quarter 3 of 2016. Business airfares and freight forwarding provided the biggest contributions to the increase. Business airfares increased 4.9% in the year to Quarter 4 of 2016, compared with an increase of 3.9% in the year to Quarter 3 of 2016. Freight forwarding prices increased 1.6% in the year to Quarter 4 of 2016, compared with an increase of 0.4% in the year to Quarter 3 of 2016.
Administrative and support services showed the only downward contribution within the SPPI. Prices fell 0.5% in the year to Quarter 4 of 2016, compared with a rise of 0.7% in the year to Quarter 3 of 2016. This decrease was largely a result of the fall in prices for recruitment and personnel services where prices fell 0.9% in the year to Quarter 4 of 2016, compared with a rise of 0.5% in the year to Quarter 3 of 2016.
The SPPI increased 1.4% in the year to Quarter 4 of 2016, compared with an increase of 1.6% in the year to Quarter 3 of 2016. Figure 3 shows how the SPPI sections have contributed towards this 0.2 percentage points change.
Increases in the prices of water supply, sewerage and waste, vehicle repair and maintenance, and transportation and storage were offset by decreases in the prices of administrative and support services, professional, scientific and technical services, and real estate activities.
Figure 3: Contribution to the change in the 12-month growth rate between Quarter 3 (July to Sept) 2016 and Quarter 4 (Oct to Dec) 2016
UK
Source: Services Producer Price Indices (SPPI) - Office for National Statistics
Notes:
- The section level SPPIs are an aggregate of individual industry level SPPIs (excluding financial intermediation) published in the SPPI statistical bulletin. They do not provide full coverage of the service sector.
- Q1 refers to Quarter 1 (January to March), Q2 refers to Quarter 2 (April to June), Q3 refers to Quarter 3 (July to September) and Q4 refers to Quarter 4 (October to December).
Download this chart Figure 3: Contribution to the change in the 12-month growth rate between Quarter 3 (July to Sept) 2016 and Quarter 4 (Oct to Dec) 2016
Image .csv .xls
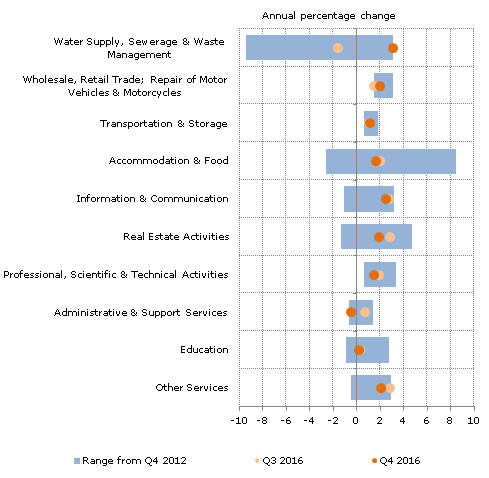
Figure 4: Services Producer Price Index by section
Quarter 4 (Oct to Dec) 2012 to Quarter 4 (Oct to Dec) 2016, UK
Source: Services Producer Price Indices (SPPI) - Office for National Statistics
Notes:
- Q1 refers to Quarter 1 (January to March), Q2 refers to Quarter 2 (April to June), Q3 refers to Quarter 3 (July to September) and Q4 refers to Quarter 4 (October to December).
Download this image Figure 4: Services Producer Price Index by section
.png (19.4 kB) .xls (29.2 kB)
Examining inflation for each of the sections that contribute to the SPPI reveals a diverse set of trends. Figure 4 shows both the range of annual inflation rates experienced by each of the sections since Quarter 4 of 2012 and the annual rates of inflation for the 2 most recent quarters.
One notable difference between each section is the range of inflation rates that have been experienced since 2012. Water supply, sewerage and waste management services, accommodation and food, and real estate activities have experienced a relatively wide range of inflation rates over this period. Although all sections have experienced some variance in inflation, certain industries have experienced inflation consistently higher than others. Wholesale and retail trade, vehicle repair and maintenance has not experienced inflation lower than 1.5% at any point in the past 5 years, while transportation and storage services has not experienced inflation higher than 1.8%.
Nôl i'r tabl cynnwys5. Quarterly inflation
Prices received for the services included in the Services Producer Price Index (SPPI) rose 0.2% between Quarters 3 (July to Sept) and 4 (Oct to Dec) of 2016, unchanged from the last quarter. Of the 10 sections that make up the SPPI, only 5 showed increases in prices between Quarter 3 and 4 of 2016.
The largest increase in the quarterly rate came from water supply, sewerage and waste management, which increased by 1.4% between Quarters 3 and 4 of 2016. The remaining increases were small, ranging from 0.2% to 0.8% (Table 3).
The largest decreases in the quarterly rate came from accommodation and food, and other personal services, both falling 0.4% between Quarter 3 and Quarter 4 of 2016.
Table 3: Quarterly growth in Services Producer Price Index (percentage change, latest quarter on previous quarter)1
| Quarter 4 (Oct to Dec) 2016, UK | |
| Section | Quarterly percentage change |
|---|---|
| Water supply, sewerage and waste management | 1.4 |
| Repair and maintenance of motor vehicles | 0.8 |
| Transportation and storage | 0.3 |
| Accommodation and food | -0.4 |
| Information and communication | -0.1 |
| Real estate activities | 0.3 |
| Professional, scientific and technical activities | 0.2 |
| Administrative and support services | -0.1 |
| Education | -0.1 |
| Other services | -0.4 |
| SPPI | 0.2 |
| Source: Services Producer Price Indicies (SPPI) - Office for National Statistics | |
| Notes: | |
| 1. The section level SPPIs are an aggregate of individual industry level SPPIs (excluding Financial Intermediation) published in the SPPI Statistical Bulletin. They do not provide full coverage of the service sector. | |
Download this table Table 3: Quarterly growth in Services Producer Price Index (percentage change, latest quarter on previous quarter)^1^
.xls (25.6 kB)
Figure 5: Contribution to Services Producer Price Index quarterly growth1
Quarter 4 (Oct to Dec) 2016, UK
Source: Services Producer Price Indices (SPPI) - Office for National Statistics
Notes:
- The section-level SPPIs are an aggregate of the individual industry-level SPPIs (excluding financial intermediation) published in the SPPI statistical bulletin. They do not provide full coverage of the section listed.
Download this chart Figure 5: Contribution to Services Producer Price Index quarterly growth^1^
Image .csv .xlsTransportation and storage services showed the largest contribution to the SPPI rate between Quarters 3 and 4 of 2016, with prices rising by 0.3%, compared with an increase of 0.5% between Quarters 2 and 3 of 2016. The main contributions to this increase were from business airfare prices, which increased 1.4% between Quarters 3 and 4 of 2016.
Professional, scientific and technical activities had the second largest contribution to the quarterly rate, increasing by 0.2% between Quarter 3 and Quarter 4 of 2016. The movement was driven by changes in the prices of business and management consultancy, and advertising services, which increased by 1.0% and 1.2% respectively.
Nôl i'r tabl cynnwys6. Economic context
Comparison with Consumer Prices Index
While the Services Producer Price Index (SPPI) measures the amount of money received by a company for services they’ve provided to other businesses and government, the prices paid by households is estimated by the Consumer Prices Index (CPI). While the costs associated with providing services to both businesses and households will be broadly similar, there may be different costs associated with providing services to different customers. Figure 6 shows a comparison with the “all services” sector of the CPI, which measures the prices paid for services by households.
Figure 6: Comparison of Services Producer Price Index and ''all services'' Consumer Prices Index1,2,3,4
Quarter 1 (Jan to Mar) 2004 to Quarter 4 (Oct to Dec) 2016, UK
Source: Services Producer Price Indices (SPPI) and Consumer Prices Index (CPI) - Office for National Statistics
Notes:
- SPPI measures changes in the price received by a company, CPI measures changes in the price paid by a consumer. Therefore CPI figures may include taxes and fees that are not retained by the service provider.
- SPPI measures the price received for services provided by UK based suppliers only, excluding imports from non-UK suppliers. CPI aims to measure the price paid by consumers in the UK, who may use non-UK based suppliers.
- SPPI uses standard industrial classification 2007 (SIC 07) to produce its aggregate, CPI uses classification of individual consumption according to purpose (COICOP). This means that the structure of each index may not always correlate at more detailed levels.
- Q1 refers to Quarter 1 (January to March), Q2 refers to Quarter 2 (April to June), Q3 refers to Quarter 3 (July to September) and Q4 refers to Quarter 4 (October to December).
Download this chart Figure 6: Comparison of Services Producer Price Index and ''all services'' Consumer Prices Index^1,2,3,4^
Image .csv .xlsFigure 6 shows that generally inflation in the CPI “all services” index runs at a higher rate than the SPPI. During the economic downturn in 2008 to 2009, the annual rates of inflation for both indices decreased and then recovered in 2010. The SPPI annual growth rate, however, did not return to pre-downturn rates, but remained relatively subdued at an average annual growth of 1.1% between 2010 and 2016. This is broadly in line with growth rates seen in 2004 to 2005. In the latest period, Quarter 4 (Oct to Dec) 2016, the SPPI annual growth was slightly above this long-term trend at 1.4%.
In contrast, the all services CPI annual growth rate rose to pre-downturn levels by early 2011, but has since declined to 2.3% in Quarter 4 2016 and has been broadly flat since Quarter 4 2014. In both series, the most recent movement in the 12-month growth rate in prices has been downwards. This is in contrast to the headline CPI 12-month growth rate, which increased between Quarter 3 (July to Sept) and Quarter 4 from 0.7% to 1.2%.
For many services, the cost of labour is the largest component of the price charged by businesses for providing the service, rather than the cost of goods or fuels. As a result, a change in average wages of the workforce in the service sector can have an important impact on the SPPI. Previous analysis has shown that the price charged for services moves in a similar way to the service sector regular pay.
This may explain why the growth in the SPPI has generally been lower in the post-downturn period than in the pre-downturn period. Both average weekly earnings for those working in services and SPPI growth rates have been much lower since the economic downturn. The annual average growth rate for regular pay in the service sector was 4.1% between 2004 and 2007 but only 1.7% between 2010 and 2016.
Other measures of service sector inflation
There are other measures of service sector inflation available such as the Chartered Institute of Procurement and Supply (CIPS) Purchasing Managers’ Index and the Confederation of British Industry (CBI) Service Sector Survey. There are significant methodological differences between these surveys and SPPI; therefore, direct comparisons cannot be made.
International comparison
All countries within the European Union are required to produce a measure of producer price inflation for the services sector under the Short Term Statistics Regulation. Figure 7 shows the growth rates of services producer prices for a selection of EU countries from Quarter 3 (July to Sept) of 2011 to Quarter 3 of 2016; this is the latest comparable data available for most of the countries represented.
The UK recorded largely stable SPPIs, growing by 2.2% in Quarter 3 of 2016. This contrasts with France and Spain. France experienced negative SPPI inflation from Quarter 1 (Jan to Mar) of 2013 until Quarter 2 (Apr to June) of 2015 and has seen rises until Quarter 3 of 2016 where it has seen no change. Spain experienced negative SPPI inflation until Quarter 1 of 2015 and again since Quarter 1 of 2016. Austria has seen an increase of 1.4%, which is unchanged from Quarter 2 of 2016. Sweden has seen a fall of 0.2%, which is the first fall since Quarter 2 of 2014 and only the second fall since Quarter 3 of 2011.
Figure 7: Services Producer Price Index international comparison1,2
Quarter 3 (July to Sept) 2011 to Quarter 3 (July to Sept) 2016, UK
Source: Eurostat
Notes:
- The UK growth in this chart does not match that published as the gross sector SPPI. This is because the indices shown in this comparison only include sections G to N, as per the standard industrial classification 2007 (SIC 07). The gross sector SPPI also includes industries classified to sections E and G of SIC 07. A full list of all SIC codes included can be found in the SPPI coverage document.
- Q1 refers to Quarter 1 (January to March), Q2 refers to Quarter 2 (April to June), Q3 refers to Quarter 3 (July to September) and Q4 refers to Quarter 4 (October to December).
Download this chart Figure 7: Services Producer Price Index international comparison^1,2^
Image .csv .xlsFrance and Spain experienced the lowest average inflation rates at points across the period between Quarter 3 2011 and Quarter 3 2016, with both countries witnessing falling prices for extended periods. More recently, France witnessed a rise in prices between Quarter 3 2015 and Quarter 2 2016 and Spain between Quarters 2 and 4 of 2015, although Spain then saw prices fall again in Quarter 1 2016 and continue to fall. Austria experienced the highest average inflation rate across the period, ranging from a high of 2.6% in Quarter 4 of 2011 to a low of 0.9% in Quarter 3 of 2015.
Nôl i'r tabl cynnwys7. Net sector
At the aggregate level, both a net and gross sector Services Producer Price Index (SPPI) is produced. The prices used to construct both of these indices are the same, but different weights are used to construct the net sector index compared with the gross sector.
Summary of net sector movements
In Quarter 4 (Oct to Dec) of 2016, movements in the net sector SPPI were:
- annual inflation rose 1.3%, compared with a rise of 1.6% in the year to Quarter 3 (July to Sept) of 2016
- between Quarters 3 and 4 of 2016, quarterly inflation stood at 0.2%, unchanged since between Quarters 2 (Apr to June) and 3 of 2016
Generally, the movements of the net sector SPPI are similar to those of the gross sector indices (Figure 8).
Figure 8: Services Producer Price Index (net and gross sectors)1,2
Quarter 4 (Oct to Dec) 2011 to Quarter 4 (Oct to Dec) 2016, UK
Source: Services Producer Price Indices (SPPI) - Office for National Statistics
Notes:
- The SPPI is an aggregate of the individual industry-level SPPIs (excluding Financial Intermediation) published in the SPPI statistical bulletin. It does not provide full coverage of the service sector.
- Q1 refers to Quarter 1 (January to March), Q2 refers to Quarter 2 (April to June), Q3 refers to Quarter 3 (July to September) and Q4 refers to Quarter 4 (October to December).
Download this chart Figure 8: Services Producer Price Index (net and gross sectors)^1,2^
Image .csv .xls8. Quality and methodology
The SPPI Quality and Methodology Information document contains important information on:
- the strengths and limitations of the data and how it compares with related data
- users and uses of the data
- how the output was created
- the quality of the output including the accuracy of the data
Detailed information on the methods used to compile the SPPI is available in the SPPI manual.
Nôl i'r tabl cynnwys