
Cynnwys
- Main points
- What is the Producer Price Index (PPI)?
- Output prices: summary
- Supplementary analysis: Output prices
- Output prices: detailed commentary
- Output PPI indices by grouping
- Input prices: summary
- Supplementary analysis: Input prices
- Input prices: detailed commentary
- Input PPI indices by grouping
- Revisions
- Background notes
- Methodoleg
1. Main points
The price of goods bought and sold by UK manufacturers, as estimated by the producer price index, continued to fall in the year to November 2015. Crude oil continued to drive down input prices, feeding through to a drop in output prices of petroleum products
Factory gate prices (output prices) for goods produced by UK manufacturers fell 1.5% in the year to November 2015, compared with a fall of 1.4% in the year to October 2015
Core factory gate prices, which exclude the more volatile food, beverage, tobacco and petroleum products, fell 0.1% in the year to November 2015, compared with a rise of 0.3% in the year to October 2015
The overall price of materials and fuels bought by UK manufacturers for processing (total input prices) fell 13.1% in the year to November 2015, from a fall of 12.3% in the year to October 2015
Core input prices, which exclude the more volatile food, beverage, tobacco and petroleum products fell 8.3% in the year to November 2015, compared with a fall of 6.7% in the year to October 2015
2. What is the Producer Price Index (PPI)?
The Producer Price Index (PPI) is a monthly survey that measures the price changes of goods bought and sold by UK manufacturers and provides an important measure of inflation, alongside other indicators such as the Consumer Price Index (CPI) and Services Producer Price Index (SPPI). This statistical bulletin contains a comprehensive selection of data on input and output index series and also contains producer price indices of materials and fuels purchased and output of manufacturing industry by broad sector.
The output price indices measure change in the prices of goods produced by UK manufacturers (these are often called “factory gate prices”).
The input price indices measure change in the prices of materials and fuels bought by UK manufacturers for processing. These are not limited to just those materials used in the final product, but also include what is required by the company in its normal day-to-day running.
The factory gate price (the output price) is the price of goods sold by UK manufacturers and is the actual cost of manufacturing goods before any additional charges are added, which would give a profit. It includes costs such as labour, raw materials and energy, as well as interest on loans, site or building maintenance, or rent.
Core factory gate inflation excludes price movements from food, beverage, petroleum, and tobacco and alcohol products, which tend to have volatile price movements. It should give a better indication of the underlying output inflation rates.
The input price is the cost of goods bought by UK manufacturers for the use in manufacturing, such as the actual cost of materials and fuels bought for processing.
Core input inflation strips out purchases from the volatile food, beverage, tobacco and petroleum industries to give an indication of the underlying input inflation pressures facing the UK manufacturing sector.
Nôl i'r tabl cynnwys3. Output prices: summary
Factory gate inflation fell 1.5% in the year to November 2015, compared with a fall of 1.4% last month.
The rate of both total output and core inflation has generally been falling since autumn 2011, when output inflation reached its post-economic downturn high of 5.3% in September 2011. During this period, core factory gate inflation has tended to run at a lower rate and show a smaller degree of volatility than total output inflation. However, since January 2014, core output price inflation has been running at a slightly higher rate than total output inflation: a result of the downward pressures from petroleum, which is excluded from the core measure of inflation (Figure A).
Looking at the latest estimates (Table A), movements in factory gate prices over the 12 months to November 2015 were as follows:
factory gate prices fell 1.5%, compared with a fall of 1.4% in the year to October 2015
core factory gate prices fell 0.1%, compared with an increase of 0.3% in the year to October 2015
factory gate inflation excluding excise duty fell 1.2%, unchanged from the year to October 2015
Between October and November 2015:
factory gate prices decreased 0.2%, compared with a fall of 0.1% last month
core factory gate prices decreased 0.2%, compared with a fall of 0.1% last month
Table A: Output prices (home sales)
| UK, June to November 2015 | |||||||
| Percentage change | |||||||
| All manufactured products | Excluding food, beverage, tobacco and petroleum | All manufactured products excluding duty | |||||
| 1 month | 12 months | 1 month | 12 months | 1 month | 12 months | ||
| 2015 | Jun | 0.0 | -1.5 | 0.0 | 0.1 | 0.0 | -1.1 |
| Jul | -0.2 | -1.6 | 0.0 | 0.2 | -0.1 | -1.2 | |
| Aug | -0.5 | -1.9 | -0.1 | 0.0 | -0.5 | -1.6 | |
| Sep | -0.1 | -1.8 | 0.1 | 0.2 | -0.1 | -1.6 | |
| Oct | -0.1 | -1.4 | -0.1 | 0.3 | -0.1 | -1.2 | |
| Nov | -0.2 | -1.5 | -0.2 | -0.1 | -0.1 | -1.2 | |
| Source: Office for National Statistics | |||||||
Download this table Table A: Output prices (home sales)
.xls (24.6 kB)
Figure A: Output prices
UK, November 2011 to November 2015
Source: Office for National Statistics
Download this chart Figure A: Output prices
Image .csv .xls4. Supplementary analysis: Output prices
Table B shows the annual percentage change in price across all product groups and Figure B shows their contribution to the annual factory gate inflation rate.
Table B: Output prices, 12 months change, November 2015
| UK | |
| Product group | Percentage change |
| Food products | -1.5 |
| Tobacco and alcohol (incl. duty) | 0.7 |
| Clothing, textile and leather | -0.2 |
| Paper and printing | 0.0 |
| Petroleum products (incl. duty) | -16.5 |
| Chemical and pharmaceutical | -1.9 |
| Metal, machinery and equipment | 0.2 |
| Computer, electrical and optical | 0.2 |
| Transport equipment | -0.7 |
| Other manufactured products | 1.3 |
| All manufacturing | -1.5 |
| Source: Office for National Statistics | |
Download this table Table B: Output prices, 12 months change, November 2015
.xls (24.1 kB)
Figure B: Output prices: Contribution to 12 months growth rate, November 2015
UK
Source: Office for National Statistics
Download this chart Figure B: Output prices: Contribution to 12 months growth rate, November 2015
Image .csv .xlsTable C shows the monthly percentage change in price across all product groups and Figure C shows their contribution to the month factory gate inflation rate.
Table C: Output prices, 1 month change, November 2015
| UK | |
| Product group | Percentage change |
| Food products | -0.2 |
| Tobacco and alcohol (incl. duty) | 0.1 |
| Clothing, textile and leather | -0.4 |
| Paper and printing | 0.0 |
| Petroleum products (incl. duty) | -0.9 |
| Chemical and pharmaceutical | -0.3 |
| Metal, machinery and equipment | 0.0 |
| Computer, electrical and optical | 0.0 |
| Transport equipment | -0.3 |
| Other manufactured products | 0.1 |
| All manufacturing | -0.2 |
| Source: Office for National Statistics | |
Download this table Table C: Output prices, 1 month change, November 2015
.xls (24.1 kB)
Figure C: Output prices: Contribution to 1 month growth rate, November 2015
UK
Source: Office for National Statistics
Download this chart Figure C: Output prices: Contribution to 1 month growth rate, November 2015
Image .csv .xls5. Output prices: detailed commentary
Factory gate prices fell 1.5% in the year to November 2015, compared with a fall of 1.4% in the year to October 2015. Prior to July 2014, there had been no fall in the annual rate since October 2009, when it fell 0.1%. The main contribution to the annual rate for November 2015 came from petroleum products. Smaller falls in the prices of food products, and chemicals and pharmaceuticals also contributed towards the fall in the output of manufactured product prices (Figure B).
The monthly price index between October and November 2015 saw a fall of 0.2%, compared with a fall of 0.1% between September and October 2015. The majority of product groups showed decreases; downward movements for petroleum, clothing, textiles and leather, and food products provided the main downward contributions to the monthly rate (Figure C).
Petroleum product prices fell 16.5% in the year to November 2015, up from a fall of 17.8% in the year to October 2015. The largest decrease seen in this index was in July 2009, when it fell by 21.3%. The main contributions to the fall in the latest annual rate came from diesel and gas oil, motor spirit, and aviation turbine fuel.
Food products fell 1.5% in the year to November 2015, up from a fall of 1.7% in the year to October 2015. The monthly index for food products fell 0.2% between October and November 2015, up from a fall of 0.1% between September and October 2015. The main contribution to the decrease in the annual index came from dairy products, falling by 6.1% in the year to October 2015. The main contribution to the decrease in the monthly indices was from preserved meat and meat products which fell 0.4% between October and November 2015.
Chemical and pharmaceutical products fell 1.9% in the year to November 2015, down from a decrease of 1.7% in the year to October 2015, due to a fall in the price of chemicals and chemical products.
Clothing, textiles and leather product prices decreased 0.4% between October and November 2015, down from a fall of 0.2% between September and October 2015. A fall in the price of wearing apparel was the only contributor towards this decrease.
Core factory gate inflation
Core factory gate prices, which exclude the more volatile food, beverage, tobacco and petroleum product prices, giving a measure of the underlying factory gate inflation, fell 0.1% in the year to November 2015, compared with a rise of 0.3% in the year to October 2015. This is the first fall seen in this index since the year to November 2009. Falls in chemicals and pharmaceuticals, and transport equipment was partially offset by an increase in prices for other manufacturing products in the annual index.
The monthly index showed a fall of 0.2% between October and November 2015, compared with a decrease of 0.1% between September and October 2015. Clothing, textiles and leather, transport equipment, and chemicals and pharmaceuticals provided the largest contributions to the fall in the index, slightly offset by an increase in other manufactured products.
Output producer price index contribution to change in rate
The annual percentage rate for the output PPI in November 2015 fell 1.5%, compared with a fall of 1.4% last month, resulting in a decrease in the annual rate of 0.1 percentage points. The main contribution to the decrease came from clothing, textiles and leather, offset by petroleum products (Figure D).
Figure D Output prices: 12 month contribution to the change in rate between October and November 2015
UK
Source: Office for National Statistics
Download this chart Figure D Output prices: 12 month contribution to the change in rate between October and November 2015
Image .csv .xls6. Output PPI indices by grouping
Figure E shows the year on year growth in output PPI by grouping for the latest 2 months and the range of the price changes that have been seen in these sections since January 2015. It can be seen that the majority of output PPI indices have experienced little variance in inflation during 2015. Petroleum shows the biggest decrease, ranging from falls of 20.7% in January 2015 to 14.2% in May 2015. Tobacco and alcohol shows the biggest increase, ranging from rises of 3.6% in January 2015 to 0.4% in September 2015.
Figure E: Output prices PPI by grouping, January to November 2015
UK

Source: Office for National Statistics
Download this image Figure E: Output prices PPI by grouping, January to November 2015
.png (22.8 kB) .xls (28.7 kB)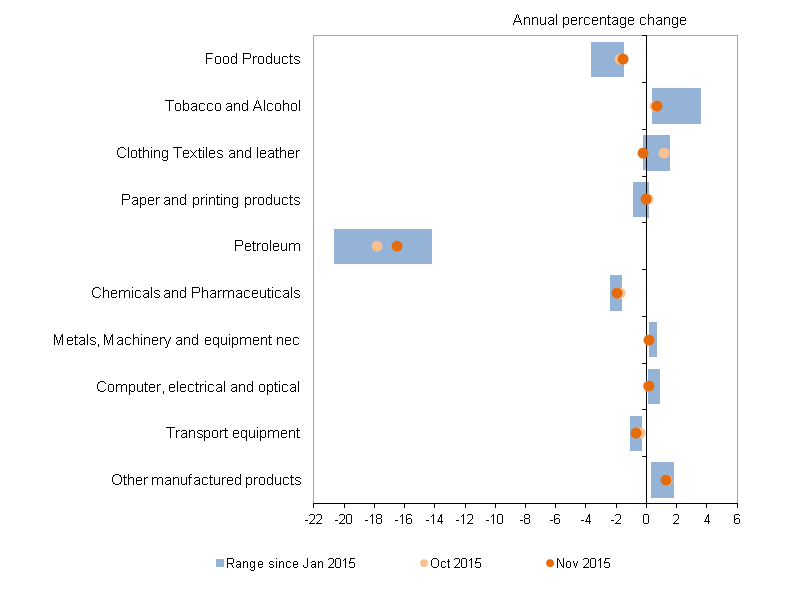
7. Input prices: summary
The price inflation of materials and fuels purchased by UK manufacturing industry, as measured by input prices, has been falling since November 2013 (Figure F). The movements in the index since February 2014 have shown input prices decreasing rapidly. The largest fall was seen in August 2015 (14.6%) with input prices currently falling by 13.1%. The core measure of inflation has also decreased through this period, but at a significantly slower rate, currently 8.3%.
Looking at the latest data (Table D), the main movements in the year to November 2015 were as follows:
the total input price index fell 13.1%, compared with a fall of 12.3% in the year to October 2015
the core input price index saw a fall of 8.3%, compared with a fall of 6.7% in the year to October 2015
the price of imported materials as a whole (including crude oil) fell 13.5%, compared to a decrease of 12.5% in the year to October 2015 ( Reference table 7 (229 Kb Excel sheet))
Between October and November 2015:
the total input price index fell 1.6%, compared with no movement last month (Table D)
in seasonally adjusted terms (see Table D), the input price index for the manufacturing industry excluding the food, beverage, tobacco and petroleum industries fell 1.3%, unchanged from last month
Table D: Input prices, percentage change
| UK, June to November 2015 | ||||||
| Percentage change | ||||||
| Materials and fuels purchased | Excluding purchases from food, beverage, tobacco and petroleum industries | |||||
| 1 month (NSA)1 | 12 months (NSA)1 | 1 month (NSA)1 | 12 months (NSA)1 | 1 month (SA)2 | ||
| 2015 | Jun | -2.2 | -13.0 | -0.9 | -4.5 | -0.5 |
| Jul | -1.4 | -12.8 | -1.0 | -4.7 | -0.6 | |
| Aug | -3.0 | -14.6 | -1.0 | -6.1 | -1.1 | |
| Sep | 0.5 | -13.4 | 0.8 | -5.7 | 0.6 | |
| Oct | 0.0 | -12.3 | -0.6 | -6.7 | -1.3 | |
| Nov | -1.6 | -13.1 | -1.2 | -8.3 | -1.3 | |
| Source: Office for National Statistics | ||||||
| Notes: | ||||||
| 1. NSA: Not Seasonally Adjusted | ||||||
| 2. SA: Seasonally Adjusted | ||||||
Download this table Table D: Input prices, percentage change
.xls (24.6 kB)
Figure F: Input prices (materials and fuel) manufacturing industry
UK, March 2012 to November 2015
Source: Office for National Statistics
Download this chart Figure F: Input prices (materials and fuel) manufacturing industry
Image .csv .xlsNotes for input prices: summary
Input price indices include the Climate Change Levy which was introduced in April 2001
Input price indices include the Aggregate Levy (13.9 Kb Pdf) which was introduced in April 2002
8. Supplementary analysis: Input prices
Table E and Figure G show the percentage change in the price of the main commodities groups over the year and their contributions to the total input index.
Table E: Input prices: 12 months change, November 2015
| UK | |
| Product group | Percentage change |
| Fuel including Climate Change Levy | -9.2 |
| Crude oil | -40.9 |
| Home food materials | -4.5 |
| Imported food materials | -4.9 |
| Other home-produced materials | 2.3 |
| Imported metals | -19.7 |
| Imported chemicals | -7.4 |
| Imported parts and equipment | -4.0 |
| Other imported materials | -3.6 |
| All manufacturing | -13.1 |
| Source: Office for National Statistics | |
Download this table Table E: Input prices: 12 months change, November 2015
.xls (24.1 kB)
Figure G: Input prices contribution to the 12 months growth rate, November 2015
UK
Source: Office for National Statistics
Download this chart Figure G: Input prices contribution to the 12 months growth rate, November 2015
Image .csv .xlsTable F and Figure H show the percentage change in the price of the main commodities groups over the month and their contributions to the total input index.
Table F: Input prices, 1 month change, November 2015
| UK | |
| Product group | Percentage change |
| Fuel including Climate Change Levy | 1.6 |
| Crude oil | -7.3 |
| Home food materials | 0.6 |
| Imported food materials | -0.6 |
| Other home-produced materials | 0.2 |
| Imported metals | -3.8 |
| Imported chemicals | -2.1 |
| Imported parts and equipment | -0.8 |
| Other imported materials | -1.1 |
| All manufacturing | -1.6 |
| Source: Office for National Statistics | |
Download this table Table F: Input prices, 1 month change, November 2015
.xls (24.1 kB)
Figure H: Input prices contribution to the 1 month growth rate, November 2015
UK
Source: Office for National Statistics
Download this chart Figure H: Input prices contribution to the 1 month growth rate, November 2015
Image .csv .xls9. Input prices: detailed commentary
The overall input index for all manufacturing, which measures changes in the price of materials and fuels purchased by manufacturers, fell 13.1% in the year to November 2015, compared with a fall of 12.3% in the year to October 2015. The main downward contributions to the index came from crude oil with a much smaller, but notable, downward contribution from imported metals.
Imported metal prices fell 19.7%, this is the largest decrease since records began in 1997. The main contribution came from imported products used in the manufacture of other basic metals and casting, which fell 20.2%. The price of the majority of metals measured in the PPI, have fallen significantly due to the recent performance of the Chinese manufacturing sector. Until recently the manufacturing sector in China has seen strong growth resulting in high demand, which pushed up prices. The current downturn in performance has meant a reduced demand for these materials and a sharp fall in their price.
The monthly input index fell 1.6% between September and October 2015, compared with no movement last month. This fall was driven by decreases in the price of crude oil, metals and chemicals, slightly offset by an increase in the price of fuel (see Table F and Figure F).
Crude oil annual prices have been falling since October 2013. The annual index fell 40.9% in the year to November 2015, Compared to a decrease of 40.7% in the year to October 2015. The monthly index for crude oil fell 7.3% between October and November 2015, compared with an increase of 1.9% between September and October 2015. The main contribution to both the annual and monthly indices came from imported crude petroleum and natural gas, which fell 40.3% in the year to November 2015, and 7.3% between October and November 2015.
In recent years, factors such as supply disruptions, concerns over the global economic recovery, instability in eurozone countries and the expectation of reduced demand have all affected oil prices. The current year on year drop is being driven by a significantly higher supply, primarily from OPEC countries, than global demand can keep up with. This oversupply in the market has caused prices to tumble and led to a number of American oil rigs temporarily ceasing production. The oversupply is so large that some analysts have suggested that oil prices could be significantly lower if it were not for the current Chinese level of demand for imported crude. This demand does not currently appear to come from their manufacturing sector, which by China’s recent standards is struggling, but from the desire to build up a surplus of oil while the price is relatively low.
The monthly index for fuel rose 1.6% between October and November 2015, compared with a rise of 0.5% last month. The increase was primarily due to gas distribution rising by 3.3%.
Core input price index (excluding purchases from the food, beverage, tobacco and petroleum industries)
The core input price index, in seasonally adjusted terms, fell 1.3% between October and November 2015, unchanged from last month. This index fell 8.3% in the year to November 2015, compared with a decrease of 7.0% in the year to October 2015.
The unadjusted index fell 8.3% in the year to November 2015, compared with a decrease of 6.7% last month; this is the largest decrease since records began in 1997. The monthly index fell 1.2% between October and November 2015, compared with a decrease of 0.6% last month. The decrease in the monthly rate is driven by falls in most of the indices except for fuel and home food materials, which showed slight growth. The biggest falls came from crude oil, imported metals and imported chemicals.
Input producer price index contribution to change in rate
The annual percentage rate for the input PPI in November 2015 fell 13.1%, compared with a decrease of 12.3% last month, resulting in a decrease in the annual rate of 0.8 percentage points. This was mainly due to falls in the contribution from fuel, imported chemicals, imported metals and imported food, this has been offset slightly by an increase in crude oil (Figure I).
Figure I: Input prices contribution to the 12 month change in rate, between October and November 2015
UK
Source: Office for National Statistics
Download this chart Figure I: Input prices contribution to the 12 month change in rate, between October and November 2015
Image .csv .xls10. Input PPI indices by grouping
Figure J shows the year on year growth in input PPI by grouping for the latest 2 months and the range of the price changes that have been seen in these groupings since January 2015. It can be seen that the majority of input PPI indices have experienced little variance in inflation during 2015. Crude oil shows the biggest decrease, ranging from falls of 48.5% in January 2015 to 37.0% in May 2015. Other home produced materials shows the biggest increase, ranging from rises of 7.7% in March 2015 to 1.5% in October 2015.
Figure J: Input prices PPI by grouping, January to November 2015
UK

Source: Office for National Statistics
Download this image Figure J: Input prices PPI by grouping, January to November 2015
.png (17.0 kB) .xls (28.7 kB)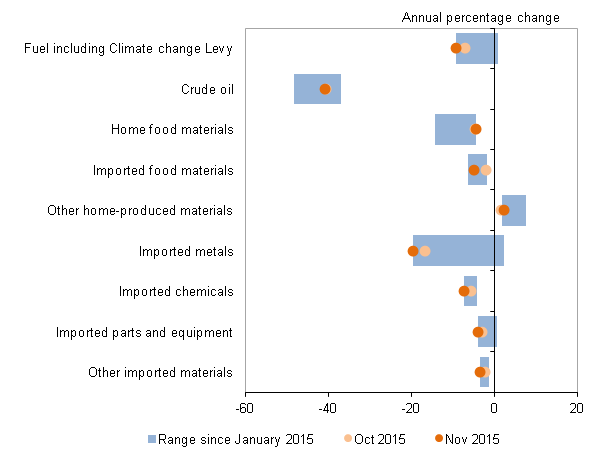
11. Revisions
For this bulletin (Reference tables 8R and 9R (229 Kb Excel sheet)) highlight revisions to movements in price indices previously published in last month’s statistical bulletin. These are mainly caused by changes to the most recent estimates, as more price quotes are received, and revisions to seasonal adjustment factors, which are re-estimated every month.
There are some large revisions in both the output and input indices caused by revisions from some data sources with high weights, for example, sugar and fish products. For more information about our revisions policy, see our website.
Table G: Revisions between first publication and estimates 12 months later
| % | |||
| Value in latest period | Revisions between first publication and estimates 12 months later | ||
| Average over the last 5 years | Average over the last 5 years without regard to sign (average absolute revision) | ||
| Total output (JVZ7) - 12 months | -1.5 | -0.16 | 0.21 |
| Total output (JVZ7) - 1 month | -0.2 | -0.01 | 0.08 |
| Total input (K646) - 12 months | -13.1 | 0.06 | 0.35 |
| Total input (K646) - 1 month | -1.6 | 0.08 | 0.27 |
| Source: Office for National Statistics | |||
| Notes: | |||
| 1. *Statistically significant | |||
Download this table Table G: Revisions between first publication and estimates 12 months later
.xls (24.6 kB)Revisions to data provide one indication of the reliability of main indicators. Table G shows summary information on the size and direction of the revisions which have been made to the data covering a 5-year period. A statistical test has been applied to the average revision to find out if it is statistically significantly different from zero. An asterisk (*) shows that the test is significant.
Table G presents a summary of the differences between the first estimates published between 2010 and 2015 and the estimates published 12 months later. These numbers include the effect of the reclassification onto Standard Industrial Classification (SIC) 2007.
Spreadsheets giving revisions triangles of estimates for all months from January 1998 through to September 2015 and the calculations behind the averages in the table are available in the reference table area of our website:
Revision triangle for total output (12 months) (2.52 Mb Excel sheet)
Revision triangle for total output (1 month) (2.48 Mb Excel sheet)
Revision triangle for total input (12 months) (2.53 Mb Excel sheet)
Revision triangle for total input (1 month) (2.52 Mb Excel sheet)
Nôl i'r tabl cynnwys