1. Main points
- The 12-month growth rate of the Consumer Prices Index including owner occupiers’ housing costs (CPIH) rose to 2.4% in August 2018.
- Consumer prices for housing, water, electricity, gas and other fuels have been rising more slowly than overall CPIH since February 2017.
- Input producer prices for gas and electricity follow similar trends to wholesale prices while consumer prices show less movement.
- Trends in the London housing market tend to start in the centre and move outwards.
2. Statistician’s comment
Commenting on today’s inflation figures, Head of Inflation Mike Hardie said:
“Consumers paid more for theatre shows, sea fares and new season autumn clothing last month. However, mobile phone charges, and furniture and household goods had a downward effect on inflation.
“UK house prices continued to grow but at their lowest annual rate for five years, driven again by a fall in London. The housing market saw strong growth in the North West, South West and West Midlands.”
Nôl i'r tabl cynnwys3. Summary
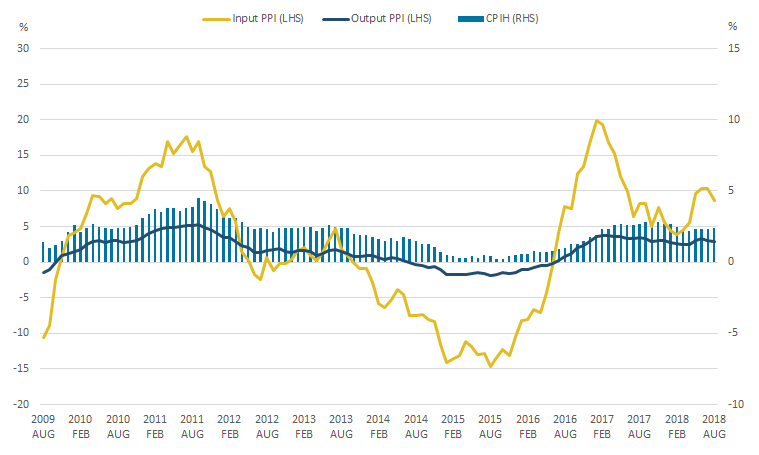
Figure 1 shows that the 12-month growth rate of the Consumer Prices Index including owner occupiers’ housing costs (CPIH) was 2.4% in August 2018, up from 2.3% in July 2018. The largest upward drivers to change in the 12-month rate of CPIH were recreational and cultural goods and services, transport services, and clothing, partially offset by downward contributions from furniture and household goods, and telecommunications. The input Producer Price Index (input PPI) grew by 8.7% in the 12 months to August 2018, down from 10.3% in the 12 months to July 2018. This was driven mainly by a slow down in prices for crude oil. The output Producer Price Index (output PPI) continued its relatively stable trend, growing by 2.9% in the 12 months to August 2018, down from 3.1% in the 12 months to July 2018. The fall in output PPI was driven mainly by petroleum products.
Figure 1: 12-month growth rates for input Producer Price Index (PPI) (left-hand side) and output PPI (left-hand side), and Consumer Prices Index including owner occupiers' housing costs (CPIH) (right-hand side)
UK, August 2009 to August 2018
Source: Office for National Statistics
Notes:
- These data are also available within the Dashboard: Understanding the UK economy.
Download this image Figure 1: 12-month growth rates for input Producer Price Index (PPI) (left-hand side) and output PPI (left-hand side), and Consumer Prices Index including owner occupiers' housing costs (CPIH) (right-hand side)
.png (25.7 kB) .xlsx (20.1 kB)
4. Prices for some household bills are growing more slowly than CPIH
Figure 2 shows the 12-month growth rate of the Consumer Prices Index including owner occupiers’ housing costs (CPIH) and the housing, water, electricity, gas and other fuels component of CPIH from January 2013 to August 2018. Movements in the 12-month growth rate for both series have been broadly similar over the period but trends for housing, water, electricity, gas and other fuels have generally been more muted than movements in headline CPIH.
Figure 2: 12-month growth rates for CPIH and housing, water, electricity, gas and other fuels
UK, January 2013 to August 2018
Source: Office for National Statistics
Download this chart Figure 2: 12-month growth rates for CPIH and housing, water, electricity, gas and other fuels
Image .csv .xlsSince February 2017, prices for housing, water, electricity, gas and other fuels have been growing more slowly than headline CPIH, with 12-month growth in August 2018 of 1.8% compared with 2.4% for overall CPIH. The housing, water, electricity, gas and other fuels component includes several typical “household bills” items and recent slowing of 12-month growth follows a period of over three years between October 2013 and January 2017 when prices were consistently growing more quickly than headline CPIH.
Figure 3 shows the 12-month growth rate of the housing, water, gas, electricity and other fuels component of CPIH and the contributions made to the rate by specific components – gas, water supply, owner occupiers’ housing, actual rentals for housing, council tax and other rates, and electricity, and the combined ‘other’ components – from January 2013 to August 2018.
Figure 3: Contributions to the 12-month growth rate of housing, water, gas, electricity and other fuels
UK, January 2013 to August 2018
Source: Office for National Statistics
Notes:
- The “other” component includes: sewerage collection, liquid fuels, solid fuels, and regular maintenance and repair of the dwelling.
- Contributions to the 12-month rate of CPIH may not sum exactly due to rounding.
Download this chart Figure 3: Contributions to the 12-month growth rate of housing, water, gas, electricity and other fuels
Image .csv .xlsOwner occupiers’ housing costs typically make the largest contribution to the 12-month growth rate of housing, water, electricity, gas and other fuels, contributing between a maximum of 1.54 percentages points in October 2016 and minimum of 0.60 percentage points in August 2018. Owner occupiers’ housing is followed by council tax and other rates which contributed 0.41 percentage points, and electricity which contributed 0.33 percentage points in August 2018. Electricity has made an increasing contribution to 12-month growth over recent years, contributing 0.34 percentage points more to the 12-month growth rate in August 2018 than in August 2016.
Gas contributed 0.17 percentage points to the 12-month growth rate of housing, water, electricity, gas and other fuels in August 2018; this contribution has been gradually increasing following a period between December 2014 and June 2017 when gas was putting downward pressure on the overall 12-month growth rate. Water supply has had a consistently small contribution to the 12-month growth rate of housing, water, electricity, gas and other fuels, remaining positive since April 2016. The relationships between consumer and producer prices for gas and electricity is explored in Figures 4 and 5.
Nôl i'r tabl cynnwys5. Wholesale and producer input gas and electricity prices follow similar trends
Figure 4 shows movements in the Ofgem wholesale prices for electricity as well as the electricity components of CPIH and the input Producer Price Index (PPI) between June 2010 and August 2018. Figure 5 shows the equivalent series for gas.
The input price for electricity represents the costs of raw materials and fuels purchased by firms producing and distributing electricity, and moves broadly in line with wholesale prices for electricity. Prior to 2014, consumer prices also moved broadly in line with wholesale prices and input producer prices but diverged when wholesale and input producer prices fell between January 2014 and February 2016 and consumer prices remained largely unchanged. Consumer prices reflect more than just wholesale prices as they also include the cost of transmission, distribution and regulatory costs as well as profits. Consumer prices also remained relatively flat when wholesale and input producer prices rose again between March and November 2016. More recently, consumer prices have increased at a similar rate to input producer prices, with both increasing more gradually than wholesale prices since August 2017.
The market for electricity, including generation, transmission, distribution and supply (PDF 6.5MB), was reviewed in October 2017 by Dieter Helm in an independent report for government on the cost of energy in the UK. This report identified that electricity prices faced by consumers are higher than would be expected based on underlying costs and highlighted complex regulations, legacy costs and the structure of the market as likely explanations.
Figure 4: Price indices for wholesale electricity and the electricity components of input PPI and CPIH
UK, June 2010 to August 2018
Source: Office for National Statistics, Office of Gas and Electricity Markets (OFGEM)
Download this chart Figure 4: Price indices for wholesale electricity and the electricity components of input PPI and CPIH
Image .csv .xlsFigure 5 shows movements in wholesale prices for gas as well as the gas components of CPIH and the input PPI between June 2010 and August 2018. As with the electricity series, input producer prices for gas have closely tracked movements in wholesale gas prices over the period, with trends for consumer prices showing more variation from 2014.
Consumer prices for gas fell only gradually when wholesale and input producer prices were falling between February 2014 and February 2016, but also remained relatively unchanged when wholesale and input producer prices rose again between April 2016 and December 2016. Most recently, consumer prices for gas have ticked up since April 2018, while input producer prices have remained relatively flat.
Differences in relative price growth for consumer, wholesale and producer gas prices likely reflect additional costs in the supply chain, regulation, different approaches to hedging among energy retailers and other market factors (for more information, see Ofgem’s Understanding trends in energy prices page).
Figure 5: Price indices for wholesale gas and the gas components of input PPI and CPIH
UK, June 2010 to August 2018
Source: Office for National Statistics,Office of Gas and Electricity Markets (OFGEM)
Download this chart Figure 5: Price indices for wholesale gas and the gas components of input PPI and CPIH
Image .csv .xls6. Trends in the London housing market tend to start in the centre and radiate outwards
In July 2018, the 12-month growth rate for house prices in London was negative 0.7%, its lowest rate since September 2009 and the third time the annual growth rate has been negative in the last five months. Exploring recent trends in the London housing market, released today (19 September 2018), looks in more detail at trends underlying recent movements in annual house price growth in London and differences within London.
The map below shows how 12-month growth rates for house prices and for sales volumes, and the average house price have changed over time across London.
Figure 6: Movements in average house prices, and the 12-month growth rate of HPI and sales volumes
London, January 2006 to July 2018
Embed code
Tab 2 shows changes in the 12-month growth rate for house prices often start in boroughs in central and west London before moving outwards to the rest of the capital. This trend is visible in the build-up to the financial crisis in 2006 and 2007 where house prices were growing most quickly in central London then moving outwards, and during the economic downturn when house price growth fell sharply starting in central boroughs before reaching all of London. The same trend can be seen when house price growth increased steadily again between 2013 and 2015 and in recent negative house price growth, which has covered an increasing number of boroughs in recent months.
Annual growth in sales volumes – shown in tab 1- follows similar trends to house price growth, with increases and falls starting in the centre before radiating outwards. All boroughs had positive sales growth in March 2016 and negative sales growth in April 2016, which coincides with the introduction of a higher rate of Stamp Duty on additional properties in April 2016. The increases in sales growth in March 2016 were particularly pronounced in Kensington and Chelsea, Hammersmith and Fulham, and Richmond upon Thames.
Average price by borough, in tab 3, shows only gradual variation over time as the relative value of properties in different boroughs remains fairly static. However, it can be seen from the interactive map that house prices in all boroughs have built up gradually over the period such that none of the boroughs now have average prices in the lowest price bracket.
Nôl i'r tabl cynnwys