1. Main points
The 12-month growth rate of the Consumer Prices Index including owner occupiers’ housing costs (CPIH) remained unchanged at 2.3% in June 2018, with upward pressure from gas, electricity and motor fuels offset by downward contributions from clothing and footwear, and games, toys and hobbies.
12-month growth in the input Producer Price Index rose to 10.2% this month, with growth in the output Producer Price Index rising to 3.1%.
The Services Producer Price Index grew by 1.4% in the 12 months to Quarter 2 (Apr to June) 2018, down from 1.7% in the 12 months to Quarter 1 (Jan to Mar) 2018.
UK annual house price growth was 3.0% in May 2018, its lowest rate since August 2013.
2. Statistician’s comment
Commenting on today’s inflation figures, Head of Inflation Mike Hardie said:
“Consumers have been feeling the benefit of the summer clothing sales, and computer game prices have also fallen. However, gas and electricity, and petrol prices all rose, with consumers seeing the highest price at the pump for nearly four years, with inflation remaining steady overall.
“House prices rose at their slowest pace in nearly five years due to slower annual growth in the south and east of England. However, this was partially offset by the buoyant property market in the Midlands.”
Nôl i'r tabl cynnwys3. Summary
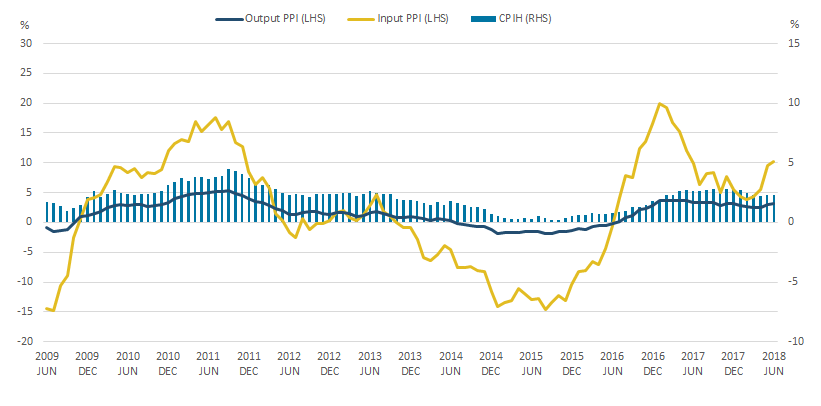
Figure 1 shows that the 12-month growth rate of the Consumer Prices Index including owner occupiers’ housing costs (CPIH) remained at 2.3% in June 2018. The largest upward drivers of change in the 12-month rate between May and June 2018 were transport, and housing, water, electricity, gas and other fuels, with downward contributions coming from clothing and footwear, and recreation and culture. The input Producer Price Index (input PPI) grew by 10.2% in the 12 months to June 2018, up from 9.6% in the 12 months to May 2018. This was driven mainly by increases in prices for crude oil. The output Producer Price Index (output PPI) grew by 3.1% in the 12 months to June 2018, up from 3.0% in the 12 months to May 2018. The largest upward contribution was from coke and refined petroleum products.
Figure 1: 12-month growth rates for input Producer Price Index (PPI) and output PPI (left-hand side), and Consumer Prices Index including owner occupiers' housing costs (CPIH) (right-hand side)
UK, June 2006 to June 2018
Source: Office for National Statistics
Notes:
- These data are also available within the Dashboard: Understanding the UK economy.
Download this image Figure 1: 12-month growth rates for input Producer Price Index (PPI) and output PPI (left-hand side), and Consumer Prices Index including owner occupiers' housing costs (CPIH) (right-hand side)
.png (21.6 kB) .xls (48.1 kB)
4. 12-month growth in CPIH remained unchanged in June 2018 at 2.3%
Figure 2 shows the contributions made to the 12-month growth rate of the Consumer Prices Index including owner occupiers’ housing costs (CPIH) by import intensity categories, as well as separate categories for energy and owner occupiers’ housing cost (OOH). The sterling effective exchange rate series is shown on the right-hand axis and has been inverted, meaning that a fall in the value of sterling is represented by a rise on the chart. This is for comparison with the CPIH growth rate as a fall in the value of sterling would, all else being equal, increase the cost of imported goods and services. This import intensity analysis is based on methodology from the January 2018 Economic Review.
Figure 2: Contributions to the 12-month growth rate of CPIH by import intensity category (left-hand side) and the inverted sterling effective exchange rate (right-hand side)
UK, January 2011 to June 2018

Source: Office for National Statistics, Bank of England
Notes:
- Contributions to the 12-month growth rate of CPIH may not sum exactly due to rounding.
Download this image Figure 2: Contributions to the 12-month growth rate of CPIH by import intensity category (left-hand side) and the inverted sterling effective exchange rate (right-hand side)
.png (34.1 kB) .xls (41.5 kB)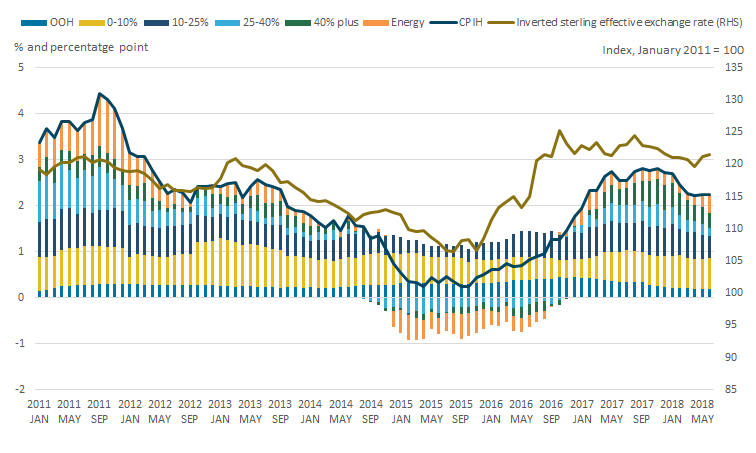
The lower import intensity categories, and owner occupiers’ housing costs, make relatively stable contributions to the headline 12-month growth rate for CPIH over the period, with changes to the inflation rate driven mainly by changes within the higher import intensity categories and energy. The 12-month growth rate for CPIH has moved broadly in line with movements in the sterling effective exchange rate over recent years, reflecting the role of exchange rates in the movements of growth of prices in the higher import intensity categories and energy.
The two higher import intensity categories, and energy, had negative 12-month growth between December 2014 and mid-2016, with growth in all three of these categories turning positive by December 2016. This mirrors the movements in the effective exchange rate with the value of sterling falling between November 2015 and April 2016, and again falling sharply following the EU referendum in June 2016. Both the exchange rate, and 12-month growth rates in the higher import intensity categories, have stabilised somewhat since early 2017.
Figure 3 shows the index series for the prices of the four import intensity categories between January 2011 and June 2018. Prices for the two lowest import intensity categories have grown the most over the period with 23.7% and 18.5% growth, respectively, for the 0% to 10% and the 10% to 25% import intensity categories, compared with growth of 7.2% for the 25% to 40% category and 8.7% for the 40% plus category over the period.
Figure 3: Consumer Prices Index including owner occupiers' housing costs (CPIH) by selected import intensity category
UK, January 2011 to June 2018
Source: Office for National Statistics
Download this chart Figure 3: Consumer Prices Index including owner occupiers' housing costs (CPIH) by selected import intensity category
Image .csv .xlsPrice movements for the higher import intensity categories have been more volatile over the period than those for the lower import intensity categories, which is unsurprising given that the effective exchange rate has fluctuated over the period and, naturally, has greater influence over the higher import intensity categories.
Prices in the higher import intensity categories broadly fell slightly between mid-2013 and mid-2016, as the value of sterling was increasing, while prices for the lower import intensity categories continued to increase at a relatively steady pace. This mirrors the movements in the 12-month growth rates seen in Figure 2, with the lower import intensity categories making relatively stable contributions to the 12-month growth rate while the contributions from the higher import intensity categories varied more.
In addition to exchange rate effects, the relative movements in prices between the higher and lower import intensity categories likely reflect the make-up of these groupings. The lower import intensity categories contain a high proportion of service components, which may be relatively labour intensive and less likely to experience falling costs, as well as highly-taxed goods such as alcohol and tobacco products for which fluctuations in market costs have less influence on the end price to consumers. Meanwhile, the higher import intensity categories contain a higher proportion of goods that are subject to a range of market factors, including seasonality, changing global prices and, in some cases, falling prices in line with technological changes, such as for data processing equipment, which is in the 25% to 40% import intensity category.
This analysis is updated each month in the reference table. This table contains contributions to CPIH and CPI from these import intensity categories, and also details the individual components that fall into each import intensity category. The methodology behind the grouping of individual components of CPIH and CPI into import intensity categories is explored in more detail in the January 2018 Economic Review.
Nôl i'r tabl cynnwys5. 12-month growth in the Services Producer Price Index fell to 1.4% in Quarter 2 2018
Second quarter estimates for the Services Producer Price Index (SPPI) are published today (18 July 2018). This is the first SPPI release on a new publication schedule, which sees results being published around two to three weeks after the end of the quarter, instead of the previous six-week period.
Figure 4 shows the contributions made to the 12-month growth rate of SPPI from a range of categories. The data are quarterly, so the latest data show the change in service producer prices between Quarter 2 (Apr to June) 2017 and the Quarter 2 2018.
Figure 4: Contributions to the 12-month growth rate of the Services Producer Price Index (SPPI) by category
UK, Quarter 4 (Oct to Dec) 2015 to Quarter 2 (Apr to June) 2018
Source: Office for National Statistics
Notes:
Q1 refers to Quarter 1 (Jan to Mar), Q2 refers to Quarter 2 (Apr to June), Q3 refers to Quarter 3 (July to Sept) and Q4 refers to Quarter 4 (Oct to Dec).
Contributions to the 12-month growth rate of SPPI may not sum exactly due to rounding.
The "other" category is an aggregated series consisting of: water supply, sewerage and waste management; repair and maintenance of motor vehicles; real estate activities; administrative and support services; and other service activities.
Download this chart Figure 4: Contributions to the 12-month growth rate of the Services Producer Price Index (SPPI) by category
Image .csv .xlsIn Quarter 2 2018, the 12-month growth rate of the SPPI fell to 1.4%, down from 1.7% in Quarter 1 (Jan to Mar) 2018. A decrease in the 12-month growth rate was seen almost across the board, with only one component of the series – information and communication – having a higher positive contribution to the 12-month growth rate of SPPI in the second quarter of 2018 than in the first quarter.
Both education, and accommodation and food, continued to have negative 12-month growth rates, contributing to the fall in the growth of overall SPPI. The education category represents training provided to businesses while the accommodation and food category includes hotels with catering, as well as canteens and catering, which are likely to provide conferencing facilities to firms.
For the last three quarters, professional, scientific and technical activities have made the largest contribution to the 12-month growth rate of SPPI, followed by transportation and storage. The two categories have high weights within the SPPI basket but have made smaller contributions to overall SPPI in previous quarters. Within professional, scientific and technical activities, the largest contributions to the 12-month growth rate came from legal services and accountancy, while the largest contribution to growth in transportation and storage came from increased prices for business class airfares.
Information and communication continued to make a positive contribution to SPPI in the second quarter of 2018, driven by increases in business prices for book publishing services and computer software, which more than offset slight decreases in business prices for telecoms and sound recording and music publishing services since the second quarter of 2017.
Nôl i'r tabl cynnwys6. UK annual house price growth was 3.0% in May 2018, its lowest rate since August 2013
The 12-month growth rate for house prices in the UK was 3.0% in May 2018, its lowest rate since August 2013, and down from 3.5% in the 12 months to April 2018. Figure 5 shows 12-month growth rates in the House Price Index (HPI) for the UK, Scotland, Wales and the regions of England in May 2018, the latest month for which data are available.
Figure 5: Regional 12-month growth rates of average house prices, May 2018
UK, Scotland, Wales and English regions, May 2018
Source: HM Land Registry, Office for National Statistics
Notes:
The chart uses the latest available data: house price 12-month growth for May 2018.
Northern Ireland has not been included as the latest available data are for Quarter 1 (Jan to Mar) 2018.
Download this chart Figure 5: Regional 12-month growth rates of average house prices, May 2018
Image .csv .xlsAnnual house price growth in London was negative 0.4% in May 2018, the fourth consecutive month of negative annual growth. This continues a broadly downward trend in the 12-month growth of London house prices since a peak of 14.8% growth in March 2016, but is up slightly from the low point of negative 0.7% growth in March 2018.
As previously noted, the decrease in house price growth in London since March 2016, likely reflects changing demand for properties in the capital following the introduction of a higher rate of Stamp Duty on additional properties in April 2016, as well as a wider lack of affordability due to historic high prices in London. The South East and East of England have also experienced a slowdown in annual house price growth, from 13.2% for both regions in March 2016 to 2.2% and 2.4% growth, respectively, in May 2018.
This considerable slowdown in London and the South East is partially offset by higher house price growth elsewhere. The East Midlands has the highest 12-month growth rate in May 2018, at 6.3%, and since February 2017 has been one of the three regions with the strongest 12-month growth fluctuating between 5% and 7%. House price growth in this region likely reflects a range of factors including connectivity to London and Birmingham and local factors such as business areas and investment in infrastructure. Following the changes to Stamp Duty on second properties, there may have been a shift in the buy-to-let market, with some landlords moving out of the capital and into regions with lower average house prices subject to a lower overall rate of Stamp Duty.
Nôl i'r tabl cynnwysManylion cyswllt ar gyfer y Erthygl
Related publications
- Consumer price inflation, UK: June 2018
- Index of Private Housing Rental Prices, Great Britain: June 2018
- Services producer price inflation, UK: April to June 2018
- Private rental growth measures, a UK comparison: April to June 2018
- UK House Price Index: May 2018
- Producer price inflation, UK: June 2018