Cynnwys
- Main points
- Statistician’s comment
- Summary
- Food and non-alcoholic beverages, and transport have been two of the largest contributors to the 12-month growth rate of CPIH in recent years
- New-builds make up a higher proportion of total property sales in London compared with any other region of the UK
- A third of property transactions in the UK are cash purchases
- Authors
1. Main points
- The 12-month growth rate of the Consumer Prices Index including owner occupiers’ housing costs (CPIH) remained unchanged at 2.3%.
- Food and non-alcoholic beverages, and transport have been two of the largest contributors to the 12-month growth rate of CPIH in recent years.
- New-builds make up a higher proportion of total property sales in London compared with any other region of the UK.
- Cash purchases make up around a third of total property transactions in the UK.
2. Statistician’s comment
Commenting on today’s inflation figures, Head of Inflation Mike Hardie said:
“Transport tickets and fuel, along with often erratic computer game prices, drove up costs for consumers. On the other hand, there was a drop in prices for women’s clothing and footwear, and some financial services.
“The housing market across the UK again slowed, with London house prices seeing their largest annual fall since September 2009 in the aftermath of the economic downturn.”
Nôl i'r tabl cynnwys3. Summary
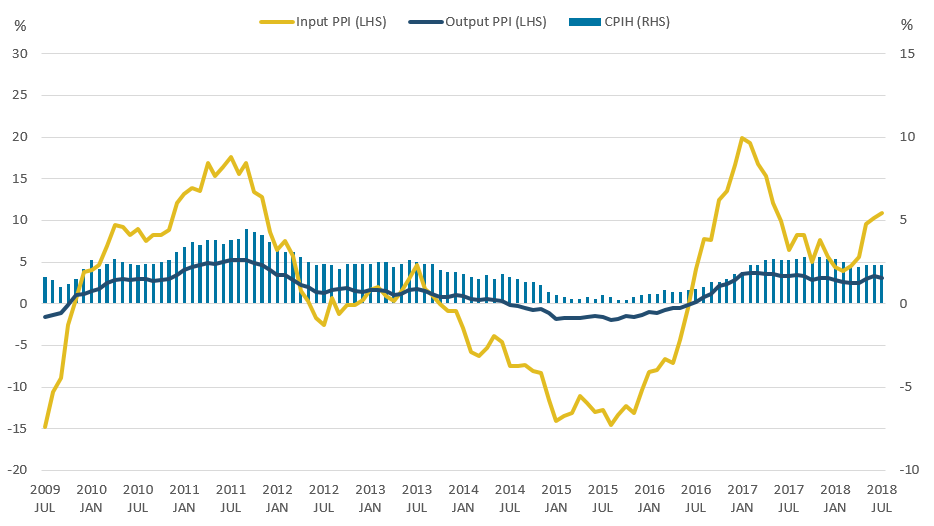
Figure 1 shows that the 12-month growth rate of the Consumer Prices Index including owner occupiers’ housing costs (CPIH) remained at 2.3% in July 2018. The largest upward drivers of the 12-month rate of CPIH were computer games and transport, offset by downward contributions from clothing, and miscellaneous goods and services, specifically the removal of initial charges for investment in some unit trusts. The input Producer Price Index (input PPI) grew by 10.9% in the 12 months to July 2018, up from 10.3% in the 12 months to June 2018. This was driven mainly by increases in prices for crude oil. The output Producer Price Index (output PPI) grew by 3.1% in the 12 months to July 2018, down from 3.3% in the 12 months to June 2018.
Figure 1: 12-month growth rates for input Producer Price Index (PPI) (left-hand side) and output PPI (left-hand side), and Consumer Prices Index including owner occupiers' housing costs (CPIH) (right-hand side)
UK, July 2009 to July 2018
Source: Office for National Statistics
Notes:
- These data are also available within the Dashboard: Understanding the UK economy.
Download this image Figure 1: 12-month growth rates for input Producer Price Index (PPI) (left-hand side) and output PPI (left-hand side), and Consumer Prices Index including owner occupiers' housing costs (CPIH) (right-hand side)
.png (33.8 kB) .xls (54.8 kB)
4. Food and non-alcoholic beverages, and transport have been two of the largest contributors to the 12-month growth rate of CPIH in recent years
Over the last two and a half years, two of the biggest contributors to the headline 12-month growth rate of the Consumer Prices Index including owner occupiers’ housing costs (CPIH) have been transport, and food and non-alcoholic beverages. Between them, the two components have had contributions to headline CPIH between negative 0.37 percentage points in April 2016 and positive 0.90 percentage points in July 2018. Both components have put upward pressure on CPIH growth since February 2017.
Figure 2 shows the contributions made to the 12-month growth rate of CPIH by transport, food and non-alcoholic beverages and a combined “other” category, which includes the other 10 divisions of CPIH. The contribution that the “other” category has made to 12-month growth in CPIH has ranged from a low of 0.92 percentage points in January 2016 to a peak of 2.16 percentage points in August 2017.
Figure 2: Contributions to the 12-month growth rate in CPIH from transport, food and non-alcoholic beverages and other components
UK, January 2016 to July 2018
Source: Office for National Statistics
Notes:
- The “other” component is an aggregated category consisting of: education, alcoholic beverages and tobacco, health, clothing and footwear, communication, recreation and culture, restaurants and hotels, miscellaneous goods and services, furniture, household equipment and maintenance, and housing, water, electricity, gas and other fuels.
- Contributions to the 12-month rate of CPIH may not sum exactly due to rounding.
Download this chart Figure 2: Contributions to the 12-month growth rate in CPIH from transport, food and non-alcoholic beverages and other components
Image .csv .xlsLooking at the components that make up transport, and food and non-alcoholic beverages we can see how prices have moved for lower-level components and what has driven the changes in these higher-level categories in recent years. Figure 3 shows price indices for selected components of food and non-alcoholic beverages, indexed to January 2016.
Figure 3: Price indices for selected components of food and non-alcoholic beverages within the Consumer Prices Index including owner occupiers’ housing costs (CPIH)
UK, January 2016 to July 2018
Source: Office for National Statistics
Download this chart Figure 3: Price indices for selected components of food and non-alcoholic beverages within the Consumer Prices Index including owner occupiers’ housing costs (CPIH)
Image .csv .xlsThe highest overall price growth since January 2016 has been in the fish, and oils and fats components, which have grown by 12.4% and 13.8%, respectively, over the period. Price rises for fish likely reflect a range of non-domestic factors including poor catches, increasing global demand and the strengthening of the Norwegian Krone. As fish, and oils and fats are both relatively import-intensive components of CPIH (around 40% of total imports) the depreciation of sterling since mid-2016 may have added to the price growth of both components over the period. Prices for oils and fats have also been affected by dairy shortages reported last year.
All of the components of food and non-alcoholic beverages are relatively import-intensive and they all saw some degree of price increase following the depreciation of sterling in mid-2016. Since then, prices for meat and vegetables have remained relatively flat while fruit prices have fallen in recent months.
Mineral waters, soft drinks and juices have seen considerable price increases in recent months, with a record increase for the time of year in March 2018 and another record increase for the time of year in April 2018. The Soft Drinks Industry Levy was introduced in April 2018, it increased the tax payable on soft drinks with more than 5 grammes per 100 millilitres of added sugar, although price increases were also seen in drinks not affected by the new levy. Prices dropped slightly in May 2018, in line with trends seen in 2014 and 2015, but have subsequently risen again in June and July 2018.
Figure 4 shows price movements for the mineral water, soft drinks and juices component of CPIH, with prices indexed to the January of each year, from January 2014 to July 2018. Prices in July 2018 were around 6% higher than in January 2018 while in three of the last four years prices fell over this period.
Figure 4: Mineral waters, soft drinks and juices component within the Consumer Prices Index including owner occupiers' housing costs (CPIH)
UK, January 2014 to July 2018
Source: Office for National Statistics
Download this chart Figure 4: Mineral waters, soft drinks and juices component within the Consumer Prices Index including owner occupiers' housing costs (CPIH)
Image .csv .xlsFigure 5 shows price indices for selected components of transport, indexed to January 2016. The two components that show the largest price variation are passenger transport by air, and passenger transport by sea and inland waterway, although both have relatively low weights. Both of these series follow fairly predictable seasonal patterns with prices rising during the school holidays and falling again during term-time, peaking in the summer months and usually being at their lowest around January. Prices in July 2018 are broadly in line with those in the previous two years for both series.
Figure 5: Price indices for selected components of transport within the Consumer Prices Index including owner occupiers’ housing costs (CPIH)
UK, January 2016 to July 2018
Source: Office for National Statistics
Download this chart Figure 5: Price indices for selected components of transport within the Consumer Prices Index including owner occupiers’ housing costs (CPIH)
Image .csv .xlsFuels and lubricants have also seen considerable price growth over the period, with prices in July 2018 around 26% higher than in January 2016. Prices for fuels and lubricants are driven in large part by global prices for crude oil, with some movements also reflecting exchange rate effects due to its relatively high import intensity. Fuels and lubricants has the highest overall weight within the transport category so is often one of the contributors to the 12-month growth rate for transport.
Passenger transport by road, which includes transport by bus and coach, and by taxi and hired car with driver has seen price growth of around 15% over the period. Prices for new cars and for passenger transport by rail have remained relatively stable by comparison with price increases of around 8% over the period.
Nôl i'r tabl cynnwys5. New-builds make up a higher proportion of total property sales in London compared with any other region of the UK
Figure 6 shows the total sales volumes for properties in 2017, split by new-builds and existing properties, for the countries of the UK and the English regions. It also shows the average price for new-builds and existing properties, respectively, for each country and region. New-builds includes properties that have been rebuilt, or have changed use to become domestic properties.
Figure 6: Total sales volumes (stacked bar, left-hand side) and average prices for new and existing builds (scatter, right-hand side) by country and English region
UK, 2017

Source: Office for National Statistics, HM Land Registry
Download this image Figure 6: Total sales volumes (stacked bar, left-hand side) and average prices for new and existing builds (scatter, right-hand side) by country and English region
.png (23.1 kB) .xls (39.9 kB)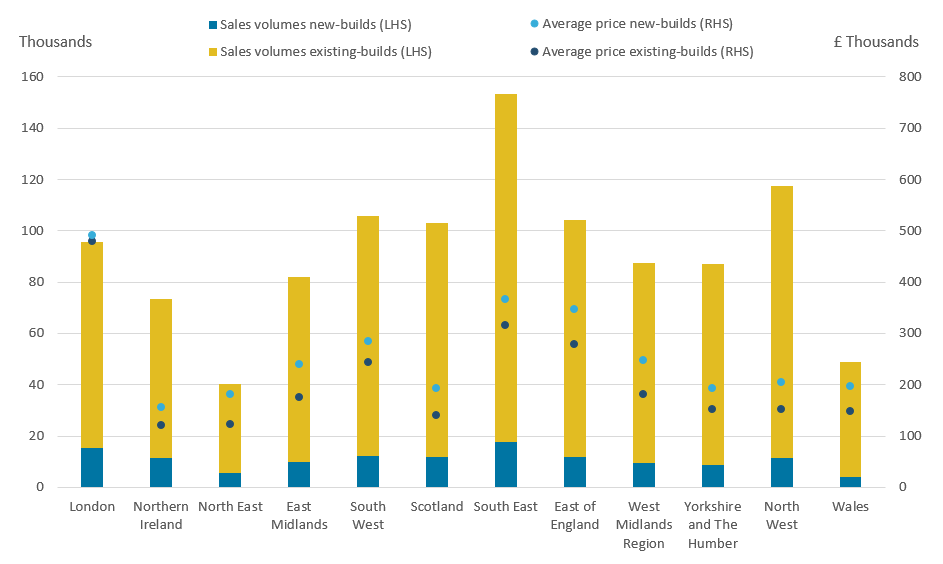
The bars are ordered based on the proportion of total sales that are accounted for by new-builds. London had the highest proportion of new-builds sold in 2017 at around 16% followed by Northern Ireland at around 15.4%. Wales had the lowest proportion of new-builds sold at around 8.1%. The South East had the highest number of new-build properties sold in 2017 but this accounted for only around 11.5% of total sales.
At the end of 2017, the Bank of England reported that new-build sales remained strong nationally (PDF, 712KB), underpinned by Help to Buy schemes, but that there had also been some signs of a softening in demand for new houses, as evidenced by greater use of incentives. Help to Buy provides loans to purchasers of new-build properties, reducing the amount of the initial deposit they are required to provide. In England, Help to Buy is available for properties up to the value of £600,000 with a loan of up to 20% of the property value, or up to 40% of the property value in London. Other similar schemes are available in the other countries of the UK.
Help to Buy may partially explain the higher proportion of new-build property sales in London as average house prices in the capital have been historically high and remain unaffordable for many. Compared with other parts of the UK, potential buyers in London face both high property prices and relatively high rents making it difficult to save for a deposit.
By reducing the amount of deposit required, Help to Buy is likely to make purchasing a property feasible for more potential buyers, but specifically for new-build properties. It may also be particularly relevant to London as the average property price for new and existing properties in London is very similar (£491,000 and £479,000 respectively). In the other countries and regions of the UK, average property prices for new-builds tend to be considerably higher than for existing properties, ranging from 16% higher in the South East to 48% higher in the North East, limiting the extent to which Help to Buy would increase the affordability of new-builds over existing properties in those areas.
Over recent years, London house price growth has slowed, with annual house price growth being negative for three of the last four months. This may also play a role in the relatively high proportion of property sales being new-builds as existing home owners may have more flexibility to delay putting their property on the market when price growth is low whereas the time taken to plan and build new properties makes the new-build market naturally less immediately responsive to changes in property prices.
Nôl i'r tabl cynnwys6. A third of property transactions in the UK are cash purchases
Figure 7 shows sales volumes for properties in 2017, split by cash and mortgage purchases, for the countries of the UK and English regions. It also shows the average property price for each country and region. The bars are ordered based on the proportion of transactions accounted for by cash purchases, cash here refers to purchases made without the use of a mortgage.
Figure 7: Sales volumes (stacked bar, left-hand side) and average property price (scatter, right-hand side) by country and English region
UK, 2017

Source: Office for National Statistics, HM Land Registry
Notes:
- The funding status of every property transaction cannot be determined, as such the sum of the cash and mortgage transactions may not equal the total.
Download this image Figure 7: Sales volumes (stacked bar, left-hand side) and average property price (scatter, right-hand side) by country and English region
.png (30.8 kB) .xls (39.4 kB)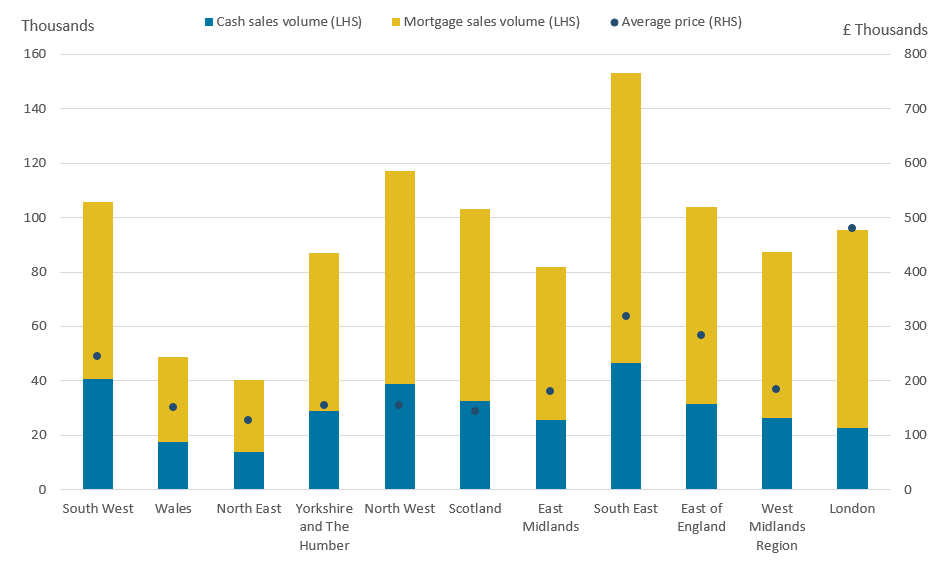
Cash purchases made up around a third of total property sales across the UK in 2017, ranging from around 39% of sales in the South West to around 24% of sales in London. With the exception of the South West, the countries and regions with the highest rates of cash purchases tended to be those with the lowest average house prices, which likely reflects the relative affordability of those areas.
The highest rate of cash transactions was in the South West, which also had the fourth-highest average property price, while the largest volume of cash transactions was in the South East, which had the second-highest average property price after London. This likely reflects the general high demand for properties in those areas including from investors and those downsizing or moving out of London. Analysis of cash transactions by London borough also suggests that boroughs with the highest average property prices tend to have the highest proportions of cash purchases, which may reflect high demand for properties in those boroughs including by investors from outside the UK.
Nôl i'r tabl cynnwysManylion cyswllt ar gyfer y Erthygl
Related publications
- UK House Price Index: June 2018
- Consumer price inflation, UK: July 2018
- CPIH-consistent inflation rates for income groups by category of spend, UK: 2005 to 2018
- Index of Private Housing Rental Prices, Great Britain: July 2018
- Producer price inflation, UK: July 2018
- CPIH-consistent inflation rate estimates for UK household groups: April to June 2018