
1. Introduction
This article provides some additional analysis of the September Producer Price Index (PPI) and Consumer Prices Index (CPI). It has a particular focus on how previous and current movements in the sterling exchange rate may have influenced these data. This is an update of the additional analysis article published in September which included an outline of how changes in the exchange rate could feed through to prices data.
Datasets are available with this release which contain longer time series of PPI and CPI contributions to growth by sector and import intensive products respectively. The datasets also contain further information on which goods and services within the CPI basket are grouped into which category of import intensity. “Import intensity” refers to the percentage of final household consumption which is directly due to imports.
Nôl i'r tabl cynnwys2. Main definitions
Producer Price Index (PPI): measures change in the prices of goods bought and sold by UK manufacturers. The PPI index is divided into an input price index and an output price index. The input price indices measure change in the prices of materials and fuels bought by UK manufacturers for processing. These are not limited to just those materials used in the final product, but also include those required by the company in its normal day-to-day running.
The output price indices measure change in the prices of goods produced by UK manufacturers (these are often called “factory gate prices”).
Further details on definitions and methodology for producing PPI are contained in the statistical release.
Consumer Prices Index (CPI): measures change in the prices of goods and services bought by households. A way to understand this is to think of a large shopping basket containing all the goods and services bought by households. Movements in price indices represent the changing cost of this basket. Further details on definitions and methodology for producing CPI are contained in the statistical release.
Sterling effective exchange rate index (ERI): measures the relative strength of a currency relative to a basket of other currencies.
Nôl i'r tabl cynnwys3. Analysis of PPI
This analysis is also covered in the “Economic context” section of the Producer Price Index (PPI) bulletin.
Input producer prices increased by 7.2% in the year to September 2016, compared with a 7.8% increase in the year to August 2016, the third consecutive month of positive input price inflation. The recent return to positive producer price inflation can be partly attributed to the changes in the sterling exchange rate, with the effective sterling exchange rate depreciating by 14.4% in the year to September 2016. All else equal, a depreciation of sterling increases the prices of UK imports, with a corresponding impact on the prices paid by producers for imports. If these producers raise their prices in turn, then movements in the exchange rate can influence output producer prices.
Figure 1: Contributions to the 12-month rate of input producer price inflation and overall input PPI rate
UK, September 2014 to September 2016
Source: Office for National Statistics
Notes:
- Contributions to Input PPI may not sum up due to weighting.
Download this chart Figure 1: Contributions to the 12-month rate of input producer price inflation and overall input PPI rate
Image .csv .xlsFigure 1 provides evidence of the positive contribution to input PPI inflation by imported food, other imported parts and equipment, and other imported materials as well as home-produced food since May 2016. However, imported metals has also seen the largest change in contribution to input PPI since May 2016 (excl. crude oil), moving from a negative contribution (-0.23) in May 2016 to a positive contribution (1.36) in September 2016, which can be partly attributed to the depreciation of the sterling.
Oil prices are also likely to have been a factor in the upward trend in input producer price inflation. The stabilisation and recent recovery of the oil price over the last year means that the downwards contribution of crude oil to the PPI inflation series has waned in recent months. This can be seen in Figure 1 as the negative contribution of crude oil to input producer price inflation began to ease off from August 2015 onwards, contributing to the gradual rise of the input PPI inflation rate. This contribution turned positive in the year to August 2016, and has continued into September 2016, with crude oil contributing 1.9 percentage points to the 7.2% increase in input producer prices. This could also explain the positive contribution from refined petroleum products to output producer price inflation in the year to September 2016.
Nôl i'r tabl cynnwys4. Analysis of CPI
The rate of inflation as measured by the Consumer Prices Index (CPI) increased 1.0% in the year to September 2016, compared to a 0.6% increase in the previous month. This is the highest rate since November 2014. However, CPI inflation remains low compared with its long-term performance. The CPI data for September 2016 is the third month to include information gathered since the UK’s referendum on its membership of the European Union, and the changes in the sterling exchange rate which followed.
Figure 2 presents contributions to the CPI from products grouped by their relative import intensities, along with the growth in the inverted effective exchange rate (ERI). Goods and services which largely originate from domestic producers are grouped together in a low-import intensity group, while products which largely come from abroad are grouped into higher import intensity groups. The ERI series has been inverted, so that a depreciation of the currency is represented by an increase in the line graph, helping to interpret a depreciation of the currency as representing a higher sterling equivalent price for imported goods and services. Energy products – which have considerable import content, on which the price of oil has a particular impact – are grouped separately. This updates the analysis previously published in the previous edition of Additional analysis of the Producer Price Index (PPI) and Consumer Price Index (CPI): Aug 2016 to include the most recent data.
Figure 2: Headline CPI inflation, contributions to inflation by import intensity and 12-month growth in effective exchange rate of sterling, monthly average (inverted)
UK, January 2008 to September 2016

Source: Office for National Statistics and Bank of England
Download this image Figure 2: Headline CPI inflation, contributions to inflation by import intensity and 12-month growth in effective exchange rate of sterling, monthly average (inverted)
.png (52.2 kB) .xls (87.6 kB)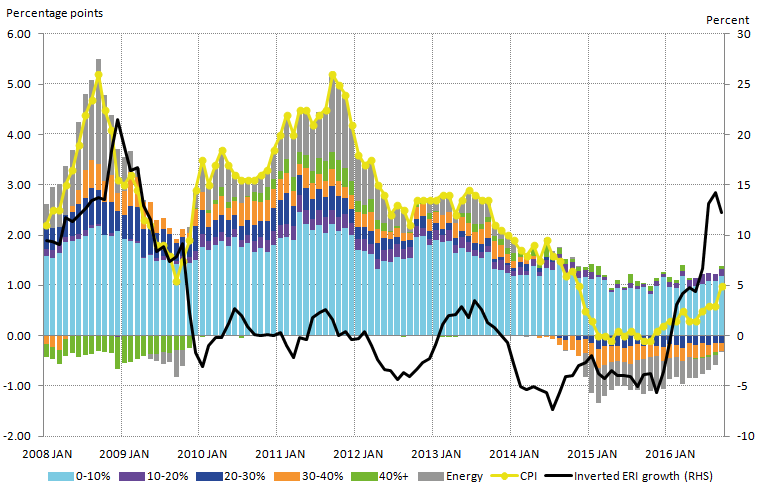
Figure 2 shows that the least import-intensive non-energy products have made a fairly steady contribution to the CPI rate of inflation between 2008 and 2016. More import-intensive products, by contrast, account for much of the rise in inflation following the depreciation of sterling in 2008 and 2009 and for much of the moderation of inflation over the last 2 years – a period during which sterling appreciated against its major trading partners.
In September 2016, the largest contribution to consumer price inflation continued to come from goods in the lowest import intensity category (0 to 10%). This group of products and services still dominates the slight upward contribution seen for the most import intensive goods and services (40% +), and the contributions for each category increased by comparable amounts in September.
Energy has seen a fall in its negative contribution to the CPI in September 2016. This can mainly be attributed to price falls between August and September last year, although it is possible that it could be influenced by the stabilising of commodity prices being offset by the depreciation of sterling.
Nôl i'r tabl cynnwys5. Next steps
We will continue to monitor the impact of changes in the sterling exchange rate on all our economic statistics and will include additional analysis in the statistical releases or separate articles where appropriate.
Nôl i'r tabl cynnwys