
1. Introduction
This section of the UK National Accounts, The Blue Book: 2017 edition provides an examination of recent trends and important movements for a range of information contained in a number of the subsequent Blue Book chapters. All UK data referred to in this section are consistent with the Blue Book 2017.
Nôl i'r tabl cynnwys2. GDP and the headline economy
Chapter 1 provides information on the headline economy, including the latest estimates of UK gross domestic product (GDP), which records how much output was produced in the UK in any given year. In September 2007, Northern Rock became the first UK bank in 150 years to suffer a bank run. To mark the tenth anniversary of the financial crisis, Figure 1 shows how the path of the economy compares with the previous three UK downturns. The financial crisis led to a peak-to-trough fall in output of 6.1%, while it took over five years for the economy to reach its pre-downturn levels. Compared with previous downturns, the effects of the financial crisis were larger in scale.
Figure 1: The last four UK downturns, 1973, 1980, 1990 and 2008
Source: Office for National Statistics
Notes:
Q1 refers to Quarter 1 (Jan to Mar), Q2 refers to Quarter 2 (Apr to June), Q3 refers to Quarter 3 (July to Sept), and Q4 refers to Quarter 4 (Oct to Dec).
Indexed to the pre-downturn peak
Download this chart Figure 1: The last four UK downturns, 1973, 1980, 1990 and 2008
Image .csv .xlsFigure 2 shows how UK GDP has evolved over the last 10 years. GDP fell by 0.5% in 2008, then by a further 4.2% in 2009. This was driven by an initial fall in gross capital formation, as gross fixed capital formation fell by 5.1% in 2008 and by 13.8% in 20091. The financial crisis led to a tightening of credit conditions and increased economic uncertainty, which impacted upon the ability and willingness of firms to invest in fixed capital. Household consumption also contracted in this period, falling by 0.6% in 2008 and by 3.3% in 2009. The deterioration in labour market conditions and the outlook for household finances led to a process of household deleveraging, in which households reduced their liabilities relative to income, by paying down debt or cutting down on new borrowing. This led to consumers cutting back on spending.
Figure 2: Contributions to real UK gross domestic product growth by expenditure, 2007 to 2016
Source: Office for National Statistics
Notes:
- Components may not sum to total gross domestic product due to rounding and loss of additivity in data prior to open period. The statistical discrepancy in 2016 is also not displayed.
Download this chart Figure 2: Contributions to real UK gross domestic product growth by expenditure, 2007 to 2016
Image .csv .xlsThe economy showed initial signs of a pickup in activity in 2010, when GDP increased by 1.7%. Figure 2 shows that the UK economy has steadily increased in the subsequent years, which in recent years has been driven by growth in consumption and investment, as the factors that weighed on the outlook in the downturn started to unwind. Despite the sterling depreciation associated with the financial crisis, net trade provided little contribution to UK GDP growth in the following years, which to some extent reflects the impact on global demand in this period.
The latest estimates show that GDP grew by 1.8% in 2016, driven primarily by household consumption, which increased by 2.9%. Gross fixed capital formation was more subdued, picking up by 1.3% in 2016. Exports grew by only 1.1%, which was more than offset by the 4.3% increase in imports, as net trade detracted from GDP growth in 2016.
Notes for GDP and the headline economy
- Gross fixed capital formation (GFCF) is a net investment concept. It refers to the net increase in physical assets in a given period, recording the total value of the acquisitions of fixed assets, less its disposals. It records the net capital expenditure by both the public and private sectors, such as spending on plant and machinery, transport equipment, software, new dwellings and other buildings, and major improvements to existing buildings and structures. GFCF is recorded under gross capital formation, which also records changes in inventories and the acquisitions less disposals of valuables.
3. Households
The Blue Book allows for an examination of the flow-stock relationship in the national accounts. The non-financial account records the flows in disposable income and how this is allocated by households between consumption and saving. The extent to which savings exceed investment is reflected in the net lending or borrowing position of each domestic sector in the UK and the rest of the world. Changes in the lending or borrowing positions are reflected in the acquisition of financial assets and liabilities by each sector, which is recorded in the financial account.
These financial flows feed into the stock position of financial assets and liabilities that are held by each sector. The change in wealth not only reflects the accumulation of new assets and liabilities, but also the revaluation of existing ones and other changes in volume, as set out in the following equation:
Stockt - Stockt-1 = Flowt + Revaluation Changest + Other Changes in Volume Accountt
For the first time, information on the revaluation changes and other changes in volumes is published in Blue Book 2017, which allows for a full reconciliation of the flow and stock positions of assets and liabilities.
In the national accounts, the economy is grouped into a number of institutional sectors, split by type of activity, ownership and control. This provides us with information on the UK’s economic performance and financial position. A comprehensive explanation of the headline sectors, income and capital accounts and the financial balance sheet can be found in the Blue Book. The households account has now been separated from the non-profit institutions serving households (NPISH) account. This section of the Blue Book focuses on recent trends in the household sector.
Households saving ratio
The households saving ratio is the proportion of total household disposable income that is saved1. Figure 3 shows how the saving ratio has evolved since 1970 and highlights how this ratio typically increases during an economic downturn. In each of the last four UK downturns, the saving ratio has risen, as households have undergone a process of deleveraging in response to the increased uncertainty around the economic outlook.
Figure 3: Households saving ratio, UK, 1970 to 2016

Source: Office for National Statistics
Notes:
- Shaded areas refer to the UK downturns
Download this image Figure 3: Households saving ratio, UK, 1970 to 2016
.png (29.2 kB) .xlsx (10.5 kB)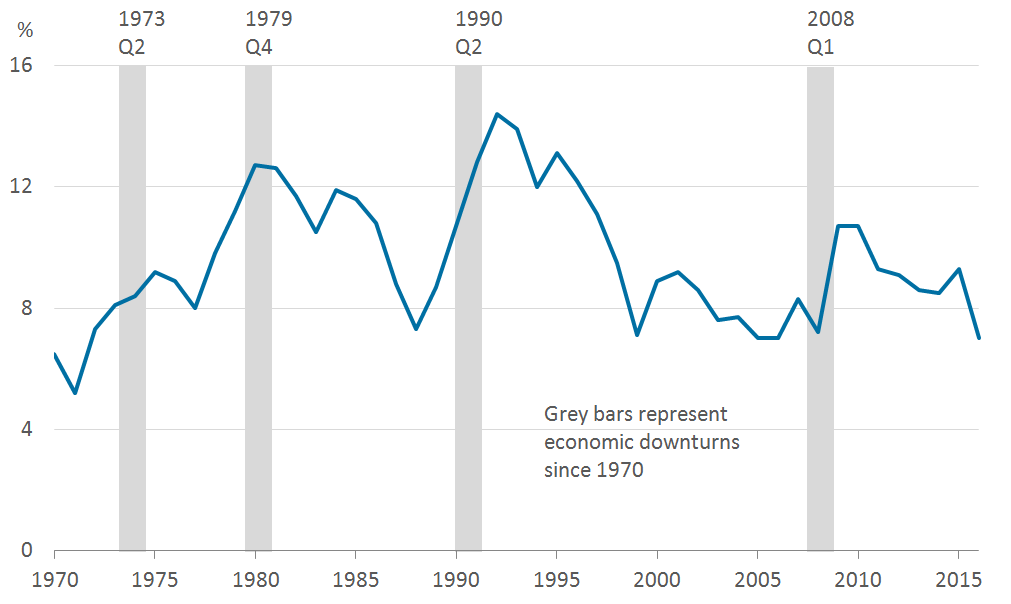
In the run-up to the financial crisis, the saving ratio had steadily declined, falling to 7.0%. As economic prospects quickly deteriorated, there was a fall in consumer confidence and households began to save a greater proportion of their income. Credit had been much more readily available to households up until 2007, but households were less able and willing to finance their spending by increasing their financial liabilities as credit conditions tightened during the financial crisis. As such, households became more reliant on saving more of their disposable household resources to finance their expenditure. The saving ratio rose sharply to 10.7% in 2009 and 2010.
In recent years, the households saving ratio has been on a downward trend as consumption growth has outstripped growth in disposable income, which has been relatively subdued. The households saving ratio fell to 7.0% in 2016.
Gross Household Disposable Income
By definition, movements in the saving ratio can be attributed to changes in total available resources and consumption expenditure. Figure 4 shows growth in gross household disposable income (GHDI), decomposed into compensation of employees (CoE) – which includes wages and salaries as well as employers’ social contributions – gross mixed income and gross operating surplus (GOS), net property income2, net social contributions and benefits, net current transfers and taxes on income and wealth.
Figure 4 shows that during the economic downturn there was a slowing in the growth of CoE in 2008 and 2009, which increased by only 1.4% and 0.4% respectively. This was offset by strong growth in households’ receipt of social benefits, which helped buffer the fall in GHDI growth. Meanwhile, mixed income and gross operating surplus (GOS) reduced GHDI growth.
As output increased from 2010, GHDI growth has also picked up. That said, it slowed to 1.5% in 2016, which was the weakest annual growth rate since 2010. This slowdown reflected an increase in taxes and falls in net property income, other current transfers, and social contributions and benefits. The largest negative contribution was net property income, driven primarily by a 16.4% fall in dividends from corporations. This is likely to reflect the forestalling of dividends, which were brought forward and paid in 2015, before an increase in taxes on dividends was introduced in April 2016.
Figure 4: Decomposition of gross household disposable income 2007 to 2016
Source: Office for National Statistics
Download this chart Figure 4: Decomposition of gross household disposable income 2007 to 2016
Image .csv .xlsHousehold consumption
As growth in GHDI slowed, nominal household consumption fell and the households saving ratio rose. Figure 5 shows that household consumption fell by 2.6% in 2009. Within household consumption, goods may be classified as durable (such as cars or furniture), semi-durable (such as clothing) or non-durable (such as food). Durable goods are those that can be used repeatedly or continuously over a period of more than a year. These are typically considered to be more discretionary in nature, as consumers can more easily delay their purchase. It is therefore expected that expenditure on these items might slow during periods of lower income growth or heightened uncertainty about the future.
There was a marked slowdown in durable goods consumption during the 2008 to 2009 downturn. In 2007, durable goods consumption increased by 6.9% in volume terms, but this fell by 2.6% in 2009. This slowdown coincided with weaker growth in household incomes, with GHDI falling year-on-year from 5.1% in 2007 to 2.4% in 2009 and an increase in the saving ratio. Meanwhile, annual growth in household consumption of non-durable goods – which comprises just over half of total household goods expenditure – saw a less marked fall during the 2008 -2009 downturn and has been on a steady upward trend since 2009, growing at an average annual rate of 0.3%.
Figure 5: Decomposition of nominal growth in total household final consumption expenditure, UK, 2007 to 2016
Source: Office for National Statistics
Download this chart Figure 5: Decomposition of nominal growth in total household final consumption expenditure, UK, 2007 to 2016
Image .csv .xlsThe slowdown in GHDI in 2016 coincided with a strong increase in consumption expenditure, with total household consumption growing by 4.4% – its strongest annual growth rate since 2007 (Figure 5) – and was reflected in the fall in the saving ratio.
Net acquisition of financial assets and liabilities by households
If savings exceed investment, that sector is able to finance the borrowing needs of others as there are net resources available. In contrast, if investment exceeds savings, that sector has a borrowing need in order to finance its expenditure. Figure 6 shows the net lending/borrowing position of households from the financial accounts over the period 1997 to 2016 and how this was financed. Positive bars indicate where households have acquired financial assets (for example, deposits and pension assets) while negative bars indicate the acquisition of financial liabilities (for example, loans). If the acquisition of assets exceeds the acquisition of liabilities, this indicates that households are lending to other sectors in the given period.
Figure 6: Net acquisition of households financial assets and liabilities, UK, 1997 to 2016
Source: Office for National Statistics
Download this chart Figure 6: Net acquisition of households financial assets and liabilities, UK, 1997 to 2016
Image .csv .xlsIt can be seen that households have been a net lender for this period, reflected in households acquiring more financial assets than liabilities. In the years leading up to the financial crisis, households acquired on average net financial assets equivalent to around 10% of gross domestic product (GDP) per year, while acquiring net financial liabilities of around 8% of GDP. Following the financial crisis, households became more of a net lender, reducing their net acquisition of financial liabilities. This corresponds with the impacts of the downturn on the cost and availability of credit, consistent with the increase in the saving ratio. The acquisitions of long-term loans secured on dwellings, fell from a net increase of £103.9 billion in 2007 to a net increase of £33.9 billion in 2008, as households undertook a process of deleveraging. The net lending position of households increased to 5.3% of GDP in 2009.
Household balance sheet
The saving ratio records how much households save of the flow of total household resources in a given period, but it does not take into consideration the net stock of financial and non-financial wealth of households. The change in wealth in a given period is equal to the accumulation of new assets and the revaluation of existing ones. These revaluation changes can be significant when the gross size of the balance sheet is large, as is the case for households (Figure 7).
Figure 7 shows the net worth (wealth) of households as a share of GDP, decomposed into financial and non-financial assets as well as financial liabilities. It shows that the value of household assets has been relatively evenly split between financial and non-financial assets over the past 10 years, with both types of assets following similar trends over time. While both financial and non-financial assets dipped in 2008 during the crisis, the fall in household net worth was driven largely by a £0.5 trillion fall in non-financial assets – predominantly in the value of land. For the first time, Blue Book 2017 is publishing a dwellings estimate that excludes the value of the land underneath the structure, with a separate estimate for the value of the land. These new estimates show that while the value of dwellings has grown steadily over the past 20 years, it has not kept pace with growth in the value of land. Land value increased from £0.7 trillion to £3.9 trillion between 1996 and 2016 (or by 479%), while the value of dwellings grew by less than half the rate at 203% (increasing from £0.5 to £1.5 trillion over the same period).
Figure 7: Net worth of households, UK, 1997 to 2016
Source: Office for National Statistics
Download this chart Figure 7: Net worth of households, UK, 1997 to 2016
Image .csv .xlsFor the first time, Blue Book 2017 includes information on these revaluations and other changes in volume of assets. These record changes in the value of assets and liabilities, but where there has not been a change in the underlying volume of these stocks. Holding gains and losses are recorded in the former, which may arise because of exchange rate movements or equity price movements.
Figure 8 shows the change in the net stock position of households and non-profit institutions serving households (NPISH), disaggregated into financial flows (net lending/borrowing for the period), other changes to volume of assets and revaluation changes. It shows that while revaluation changes can be particularly large and volatile, much of this volatility can be attributable to revaluations to pensions and insurance, which primarily reflect changes in the discount rate affecting valuations of future flows, rather than equity price or exchange rate movements. In 2016, of the £450 billion increase in the net wealth of households and NPISH 88% was due to revaluation effects.
Figure 8: Change in the net worth of households and non-profit institutions serving households, UK, 1998 to 2016
Source: Office for National Statistics
Download this chart Figure 8: Change in the net worth of households and non-profit institutions serving households, UK, 1998 to 2016
Image .csv .xlsNotes for: Households
Total household disposable income is the sum of gross household disposable income and an adjustment for the change in pension entitlements.
Income received from financial investments, such as interest on savings or dividends from shares.
4. Net lending/Borrowing by sector
The income and expenditure of each sector implies a net lending or borrowing position for households, corporations, government and the rest of the world. These flows must sum to zero by definition – for each pound that is borrowed by one sector, there must be a pound that is lent by another.
Figure 9 shows the net lending/borrowing position for each sector in the UK and from the rest of the world. This shows that the net borrowing positions of the corporate and government are offset by net lending from households and the rest of the world. In recent years, the rest of the world has increasingly become a net lender to the UK as the current account deficit has grown to 5.9% of gross domestic product (GDP) in 2016. This has been driven by a fall in net investment income, so the UK has increasingly acquired financial liabilities to finance its borrowing from the rest of the world.
In 2016, households and non-profit institutions serving households (NPISH) were a net lender of 1.1% of GDP. Following the financial crisis, the government budget deficit widened to 10.4% of GDP in 2009. This has narrowed in the intervening period in line with government policy and was 3.3% of GDP in 2016. Following the financial crisis, there was a pickup in capital investment by corporations, which has moved from being a net lender to a net borrower. In 2016, its net borrowing position was 3.3% of GDP.