1. Executive summary
The previous 5 articles on Value Added Tax (VAT) turnover outlined progress we were making in the development of this administrative data source and its tactical use in a pilot which we had planned to launch in September 2016. We are now adopting a more strategic approach and are developing the methods and data to allow us to use VAT turnover in national accounts by the end of 2017. We are working on a whole economy dataset and analysing early data to understand how we can improve our methods and share this with users, making more data available as our research progresses.
We describe the current methodology but also the data challenges which we have so far identified. The next article will be published in January 2017 and we would welcome feedback on how we could potentially improve our methods and data.
Nôl i'r tabl cynnwys2. Introduction
The Office for National Statistics (ONS) is developing a new approach for the use of microdata collected by Her Majesty’s Revenue and Customs (HMRC) from Value Added Tax (VAT) returns. We aim to include VAT turnover estimates in processing components of quarterly gross domestic product (GDP) by the end of 2017.
This research article represents the first significant publication of VAT turnover estimates as part of our commitment to incorporate a diverse range of administrative data sources for use in national accounts, while rationalising business surveys. Our 5 previous VAT articles considered how VAT turnover could be used in national accounts and described a pilot to cover up to 10 candidate industries. We are now working on a larger dataset and are sharing early estimates on current price (nominal) data, with no seasonal adjustment, from some of our research across a significant proportion of the economy.
You should be aware that this is early analysis to help us develop our statistical methodology, including defining cleaning rules and the apportionment of turnover both to ONS (statistical) reporting units and calendar months. We also note that no adjustments are currently made for incompleteness (non-response) in the dataset which will inevitably depress totals particularly in the most recent periods; however, publishing estimates from a relatively mature dataset offers a reasonable compromise between timeliness and accuracy. The various data challenges could at this stage potentially cause some statistical “error” which we will seek to mitigate. In this context “error” refers to the uncertainty inherent in any process that uses estimation or modelling.
This is the first in a series of regular articles which will share turnover estimates and update on methodological and quality developments. We would welcome your feedback on how the estimates may be improved and on what additional information we could share to reflect their quality. At this stage in the development of our VAT analysis we must state that these are early estimates and so we would caution against their use in economic modelling.
Nôl i'r tabl cynnwys3. VAT turnover data, January 2014 to March 2016
3.1 Manufacturing
Nominal estimates, derived from the VAT database of non-seasonally adjusted (NSA) turnover, for manufacturing (UK Standard Industrial Classification 2007 [SIC] 10 to 33)1 in Quarter 1 (Jan to Mar)2 2016 was £137.8 billion compared with £139.5 billion in Quarter 1 2015. Table 1 provides a time-series of nominal NSA manufacturing turnover from Quarter 1 2014.3
Table 1: VAT-derived non-seasonally adjusted current price turnover for UK manufacturing, without adjustment for non-response, £ million
| UK, Quarter 1 2014 to Quarter 1 2016 | ||||||||
| Q1 2014 | Q2 2014 | Q3 2014 | Q4 2014 | Q1 2015 | Q2 2015 | Q3 2015 | Q4 2015 | Q1 2016 |
|---|---|---|---|---|---|---|---|---|
| 137,569 | 139,069 | 140,032 | 145,061 | 139,536 | 139,913 | 139,194 | 142,871 | 137,814 |
| Source: Office for National Statistics | ||||||||
Download this table Table 1: VAT-derived non-seasonally adjusted current price turnover for UK manufacturing, without adjustment for non-response, £ million
.xls (25.6 kB)3.2 Services
Data covering 6 of the 2-digit SIC industries in the service sector, amounting to £70.1 billion in Quarter 1 2016, have also been shared in the have also been shared in the dataset attached to this article to demonstrate some of the further progress that has been made in measuring VAT turnover. These include air transport services (SIC 51) which is not currently covered by the Monthly Business Survey (MBS). Further services industries are undergoing analysis and quality assurance.
3.3 VAT return response
For Quarter 1 2016 we have so far received just over 2 million VAT returns across the whole economy. Over the same period 135,000 surveys were dispatched as part of the Retail Sales Inquiry, Construction Output Survey and the Monthly Business Survey (MBS).
Notes:
- The estimates provided in this article are classified to the 2007 UK Standard Industrial Classification (SIC).
- Throughout this release Q1 refers to Quarter 1 (January to March), Q2 refers to Quarter 2 (April to June), Q3 refers to Quarter 3 (July to September) and Q4 refers to Quarter 4 (October to December).
- As provided in all VAT returns received by 31 August 2016 and delivered to ONS in September.
4. Expanding the use of administrative data
4.1 Background
Five VAT articles were published between August 2015 and July 2016 and described how we had planned to introduce a pilot in September 2016 covering up to 10 candidate industries to replace Monthly Business Survey (MBS) data with VAT for some smaller businesses. We have developed this proposal further and are concentrating our resources on delivering a results platform. This will support a more strategic solution for use in GDP by the end of 2017.
MBS remains an important data source, offering a more timely indication of business activity than VAT turnover such that VAT cannot be used as a data source in the earliest estimates of GDP – MBS will retain that role. Where VAT turnover can add value is in its wider industrial coverage (providing estimates both at a lower level of Standard Industrial Classification (SIC) detail than that achieved by MBS and for industries not covered by the current MBS), greater scope for geographic analysis and a potentially more complete picture of activity for small and medium-sized businesses.
Over coming months we will work with counterparts in other National Statistics Institutes to harness their significant experience in the use of similar data sources and gain insights in identifying solutions to the wide variety of data challenges which we have begun to outline in section 5. We would also welcome your feedback on how the estimates could potentially be improved and on what additional information we could share to reflect the quality of the estimates. At this stage in the development of our VAT analysis we must state that these are early estimates and so we would caution against their use in economic modelling. Please contact us via email with your views: vatdev@ons.gov.uk.
4.2 VAT definitions, scope and coverage
VAT turnover microdata are sourced from box 6 of a VAT return and is defined as the “total value of sales and all other outputs excluding any VAT” for that period. The microdata cover all businesses registered with HM Revenue and Customs (HMRC) that reach the turnover threshold for VAT (currently £83,000 from April 2016) and businesses which voluntarily report VAT to HMRC. Consequently VAT turnover estimates do not offer a complete nominal picture of turnover in the economy as they do not include some smaller businesses; this is referred to as under-coverage. MBS is also impacted by under-coverage of smaller businesses.
VAT turnover definitions are broadly consistent with MBS but there are potentially some issues to reflect upon in future articles. You should note that VAT microdata:
include turnover from zero-rated, reduced-rate and exempt supplies (such that all turnover activity covered is consistent with MBS)
include turnover of businesses which register with HMRC to reclaim VAT on foreign production; however, to be consistent with national accounts GDP definitions we have removed these businesses where they have been identified
may include income from the sale of fixed assets (so VAT estimates differ from MBS where this is excluded)
will be impacted by various VAT accounting schemes agreed by HMRC such as flat rate for small businesses, annual accounting and margin
Businesses provide their VAT returns to HMRC over a period of time and the VAT turnover dataset received by the Office for National Statistics (ONS) reaches about 90% completion of returns 4 months after the end of the reference month. The VAT turnover estimates presented in this release are a simple aggregation of the returns received, with no adjustment made for those businesses yet to respond, so totals in later periods will inevitably be depressed. We consider the lag of 4 months to be a reasonable compromise between timeliness and accuracy and are presenting estimates based only on datasets with a high level of completeness, as early VAT responders are not necessarily representative of later responders. We are working further to understand patterns of response and how these might be addressed, and whether we may be able to develop a nowcasting model using early data to estimate turnover.
VAT turnover microdata are available monthly from January 2007 to the latest month (August 2016 delivered in September 2016) on a SIC 2007 basis. Microdata are available for earlier periods on earlier Standard Industrial Classifications. However, while we are developing IT results systems we will limit our analysis of time periods and industrial detail.
Nôl i'r tabl cynnwys5. Methodology
5.1 Processing of VAT turnover
VAT turnover microdata are processed on the receipt of a monthly data delivery from HM Revenue and Customs (HMRC):
HMRC delivers a dataset of VAT microdata that businesses have returned during the previous calendar month via a secure feed to the Office for National Statistics (ONS) Inter-Departmental Business Register (IDBR); the turnover figures can relate to current and previous reference periods and be reported on a monthly, quarterly or annual basis – turnover data are provided at VAT registration unit (VAT unit) level in line with a business’s 9-digit VAT registration number
we take a snapshot of the IDBR from the same month; the VAT dataset is matched to the IDBR snapshot to create links between the VAT units on the HMRC dataset and the statistical unit structure used by ONS
once the microdata have been successfully matched, the data are apportioned from VAT unit level down to ONS reporting unit level; this involves dividing the turnover linked with a business between all the reporting units associated with that business
the data are validated and cleaned to identify potential errors in the turnover figures reported by businesses
monthly data are produced from the quarterly and annual turnover figures and this turnover is assigned to the relevant months; this is referred to as calendarisation
The methods are explained in more detail in sections 5.2 to 5.5.
5.2 Matching to the IDBR
Validation checks are conducted on the VAT microdata to ensure only one VAT return (turnover value) can be attributed to a VAT registration unit for any given month. Where any VAT return has been revised the most up-to-date turnover value is used in the dataset.
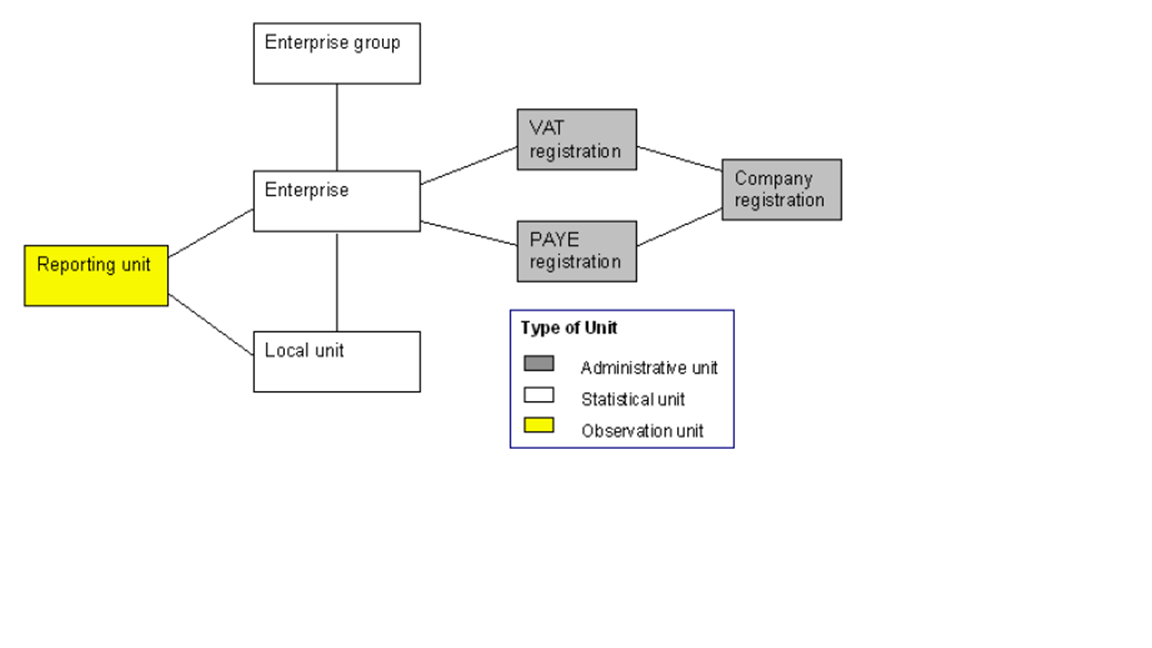
The VAT turnover file is then matched to the monthly IDBR snapshot by the VAT registration unit variable to allow turnover to be linked to enterprises and reporting units associated with the VAT registration unit. Figure 1 shows a typical simple relationship between VAT registration units and ONS statistical units in more detail. As can be seen, a business’s VAT registration unit can be linked to an enterprise on the IDBR and this enterprise can be linked to lower level statistical units such as reporting units and smaller local units. In some instances it should also be understood that enterprises commonly feature in complex corporate structures and form part of a larger enterprise group.
Figure 1: Types of Inter-Departmental Business Register unit and structures – a "simple" structure
Source: Office for National Statistics
Download this image Figure 1: Types of Inter-Departmental Business Register unit and structures – a "simple" structure
.png (57.3 kB)
Matching VAT turnover to statistical units on the IDBR is advantageous as this process enables the production of microdata with consistent units and definitions across UK National Accounts. Additionally, data from the IDBR (such as geography and industry classification) can be added through this matching process to deliver a richer data source.
5.3 Apportionment
HMRC delivers microdata at VAT registration unit level. However, for VAT data to be in line with the detailed requirements of national accounts they must be presented at ONS reporting unit (RU) level. For the majority of VAT traders the VAT registration unit is the same as their reporting unit structure such that:
one VAT unit = one IDBR enterprise = one ONS RU
These are known as “simple” businesses and account for some 90% of all returns. No apportionment is required as the VAT registration unit turnover can be wholly attributed to the sole RU of the business.
However, a group of businesses can decide to register under one VAT registration unit and so one VAT trader will report the turnover of the entire VAT group. In this instance one VAT unit is likely to be matched to multiple enterprises. Each enterprise can then be represented by one or more RU. These businesses are considered to be “complex” and consist of one of the following relationships:
- 1 VAT unit to many reporting units
- many VAT units linked to one or more reporting units
In these complex cases we must determine how turnover provided by businesses at VAT unit level is apportioned to (or shared between) the IDBR enterprises assigned to a specific VAT unit – and then how this turnover is apportioned further from each enterprise down to the associated RUs.
At present, complex businesses are apportioned based on register employment, or the employment as notified on the IDBR. This method involves dividing the VAT registration unit turnover amongst the associated IDBR enterprises based on the proportion of employment associated with each enterprise. For example, if a VAT registration unit is linked to 2 enterprises with employment in the ratio 60:40, then the turnover reported by the VAT unit will be divided such that 60% of turnover is allocated to the first enterprise and 40% to the second. This process is repeated to apportion turnover from enterprise level to RU level and to the smallest Local Unit level. We will be investigating this and alternative approaches to compare accuracy.
5.4 Cleaning and validation
Our results system cleans some 6% of RUs on average. In addition, we have manually cleaned a further 80 RUs in manufacturing (SIC 10 to 33) over the 2-year span for this publication. Three cleaning rules are applied to the data to identify potential errors.
Thousand pounds rule
The rule enables us to ensure consistency in identifying businesses that may have mistakenly included extra digits in their return by calculating the proportion between the business’s current VAT return and their previous return.
Quarterly pattern rule
Businesses reporting on a quarterly basis may effectively be reporting on an estimated basis – for example, reporting the same estimated value in 3 quarters with the fourth quarter constituting a balancing item. When a business is flagged as having a quarterly pattern, its returns are adjusted using “genuine” quarterly pattern information from businesses with similar characteristics.
Suspicious turnover rule
Businesses may return data which differ significantly from the returns made by similar businesses in the same period. When a turnover value is considered to be suspicious it is replaced by an imputed value.
5.5 Calendarisation
Businesses have the option of reporting turnover on a monthly, quarterly or annual basis with 89% of returns reported on a quarterly basis, 10% monthly and 1% annually. To spread their workload HMRC assign businesses to report on 1 of 3 quarterly staggers (ending in the first, second or third month of a calendar quarter) or to 1 of 12 annual staggers (ending in each month during the calendar year).
It is essential that all turnover values at RU level are displayed in the same format in the final dataset. As such, quarterly and annual returns are simply divided by 3 and 12 respectively to ensure that all RU level data is monthly. These turnover values are then assigned to the months that the business’s quarterly or annual staggers relate to.
Further work is required to assess the accuracy of the approach and to develop the methods used for calendarisation to incorporate seasonal trends.
Nôl i'r tabl cynnwys6. Data challenges
This section highlights areas where potential improvements to processes and methodology will be investigated. You will be notified of progress in future articles.
Estimation for incompleteness (non-response)
In section 1 we made it clear that we do not adjust VAT estimates for businesses that have yet to respond and so this has the impact of depressing values in more recent periods. In attempting to measure nominal turnover more effectively we must consider how we will take account of businesses that have yet to respond, as we do in our monthly business surveys. A number of methods and approaches are under investigation and will include an assessment of how best to combine VAT and survey data.
Cleaning and validation
We will undertake a fundamental review and analysis of cleaning, for example, in considering the extent to which the cleaning method is predicated on the use of previous returns.
Apportionment – general
We have described how the apportionment of turnover to reporting unit (RU) level is currently undertaken using register employment. Large businesses are able to file one VAT return covering a variety of different industries and our experience has shown that this is our most important data challenge. By apportioning using register employment the assumption is that turnover is related to register employment. This is not always the case and in particular we have found certain corporate (VAT) structures challenging, for example, where these include units classified to retail (SIC 47), wholesale (SIC 46), real estate (SIC 68), construction (SIC 41 to 43), head offices (SIC 70.1) and business administration (SIC 82).
Register turnover could similarly be used to carry out this process. Moreover the 2 variables could also be used to construct an approach using register turnover per head of employment. We will review the various methods which could be used to apportion turnover microdata and determine which is the most effective.
Apportionment – financial services industries
When a business in the financial services industries (SIC 64 to 66) is part of a VAT structure, apportionment of turnover becomes more problematic as these commonly have turnover at a significantly higher level than businesses in other industries. This may be addressed in part by considering different methods to apportion. The VAT estimates presented in this article potentially include turnover from financial services industries that has been apportioned to the non-financial services industries.
Turnover and gross value added
You should be aware of the significant conceptual differences between turnover, output and gross value added (the sum of outputs minus inputs). Although turnover can be a very good proxy for output for many industries, this is not universal. In particular, turnover in the financial sector is a poor proxy for output and value added.
The Index of Production and Index of Services assign a weight, as a proportion of gross value added, to each industry – it does not necessarily hold that the higher the turnover the higher the gross value added weight. This is most easily understood when considering that in 2014 the financial services industries (SIC 64 to 66) accounted for an estimated 38% of VAT turnover from our early research; while in comparison it only covered 7.6% of value added in 2013 (the latest year in which value added weights are available).
Calendarisation
The current method to derive monthly turnover estimates from quarterly and annual microdata is simplistic and we note that this serves to “flatten” the profile of VAT turnover estimates. In future we will consider using other methods to apportion the turnover.
Matching
Each month an element of VAT turnover cannot be matched from the VAT registration unit to an Inter-Departmental Business Register (IDBR) enterprise. This relatively small element appears stable but further work is required to improve the matching process and consider if there is any bias in VAT turnover estimates.
Seasonality
Seasonal adjustment methods must be developed for VAT turnover and take account of the implications from the apportionment of turnover and calendarisation.
Nôl i'r tabl cynnwys7. Next steps
The next article will be published in January 2017 and will include an update on refining and developing new methods in addition to the publication of updated VAT turnover estimates.
Nôl i'r tabl cynnwys