
Cynnwys
- The effects of the coronavirus pandemic
- Main points
- Challenges of measuring the effects of the coronavirus on the public finances
- Central government net cash requirement
- Borrowing
- Borrowing in March 2020
- Borrowing in the latest financial year
- Debt
- Revisions
- Public sector finances data
- Glossary
- Measuring the data
- Strengths and limitations
- Related links
2. Main points
This release presents the first provisional estimates of UK public sector finances for the latest full financial year (April 2019 to March 2020); these are not final figures and will be revised over the coming months as we replace our initial estimates with provisional and then final outturn data, and as more information on the effects of the coronavirus (COVID-19) pandemic becomes available.
The effects of the COVID-19 pandemic are not fully captured in this release, meaning that estimates of national accounts-based (accrued) tax receipts, borrowing and gross domestic product (GDP) in particular are subject to greater than usual uncertainty; measures of borrowing and the current budget deficit are likely to be revised upwards in future months.
Central government net cash requirement (excluding both UK Asset Resolution Ltd and Network Rail) in the latest full financial year was £56.5 billion, £19.6 billion more than in the previous financial year.
Debt (public sector net debt excluding public sector banks, PSND ex) at the end of March 2020 was £1,804.0 billion (or 79.7% of GDP); this is an increase of £30.5 billion (or a decrease of 1.0 percentage point) compared with March 2019.
Borrowing (public sector net borrowing excluding public sector banks, PSNB ex) in March 2020 was £3.1 billion, £3.9 billion more than in March 2019; the highest borrowing in any March since 2016.
Borrowing in the latest full financial year was £48.7 billion, £9.3 billion more than in the previous financial year.
Borrowing in the latest full financial year was £1.3 billion more than the £47.4 billion forecast by the Office for Budget Responsibility (OBR) in its Economic and fiscal outlook (EFO) for March 2020.
The current budget deficit (public sector current budget deficit excluding public sector banks) in the latest full financial year was in surplus by £0.9 billion, £3.9 billion less of a surplus than in the previous financial year.
4. Central government net cash requirement
There is a large degree of uncertainty within our national accounts-based (accrued) measures, so this month we place a greater emphasis than usual on our leading cash measure, the central government net cash requirement (CGNCR) (excluding both UK Asset Resolution Ltd and Network Rail).
The CGNCR is the amount of cash needed immediately for the UK government to meet its obligations. To obtain cash, the UK government sells financial instruments, gilts or Treasury Bills.
The amount of cash required will be affected by changes in the timing of tax payments by individuals and businesses but does not depend on forecast tax receipts in the same way as our national accounts-based (accrued) measures.
The CGNCR contains the timeliest information and is less susceptible to revision. However, as for any cash measure, the CGNCR does not reflect the overall amount for which government is liable or the point at which any liability is incurred – it only reflects when cash is received and spent.
Figure 1: Central government net cash requirement (CGNCR) in the latest full financial year was £56.5 billion, £19.6 billion more than in the previous financial year
CGNCR (excluding both UK Asset Resolution Ltd and Network Rail), UK, cumulative full financial year (April 2019 to March 2020) compared with the financial year ending March 2019 (April 2018 to March 2019)
Source: Office for National Statistics - Public Sector Finances
Download this chart Figure 1: Central government net cash requirement (CGNCR) in the latest full financial year was £56.5 billion, £19.6 billion more than in the previous financial year
Image .csv .xlsThe CGNCR (excluding both UK Asset Resolution Ltd and Network Rail) in March 2020 was £21.3 billion, £0.8 billion (3.5%) lower than in the previous March. Of this £21.3 billion, £18.7 billion represents the cash requirement of central government itself, while £2.6 billion largely reflects lending to local government.
In March 2020, cash receipts grew by £4.4 billion (or 8.9%) to £53.7 billion, with a £5.2 billion reduction in those taxes collected by HM Revenue and Customs (HMRC) compared with March 2019. There was a notable reduction of £5.6 billion in Value Added Tax (VAT) receipts, partly as a result of the deferral policy. This reduction in HMRC tax receipts was offset by other receipts (such as bank deposits, Vehicle Excise Duty and television licence payments), which grew by £9.2 billion compared with March 2019.
In March 2020, cash outlays grew by £2.6 billion (or 3.7%) to £72.4 billion, compared with March 2019, with an increase of £3.8 billion in net departmental outlays (such as pay, procurement, pensions and benefit payments) partially offset by a £1.2 billion reduction in interest payments.
In the latest financial year ending March 2020 (March 2019 to April 2020), the CGNCR (excluding both UK Asset Resolution Ltd and Network Rail) was £56.5 billion, £19.6 billion (or 53.1%) more than in the previous financial year. Of this £56.5 billion, £48.4 billion represents the cash requirement of central government itself, while £8.1 billion largely reflects lending to local government.
Nôl i'r tabl cynnwys5. Borrowing
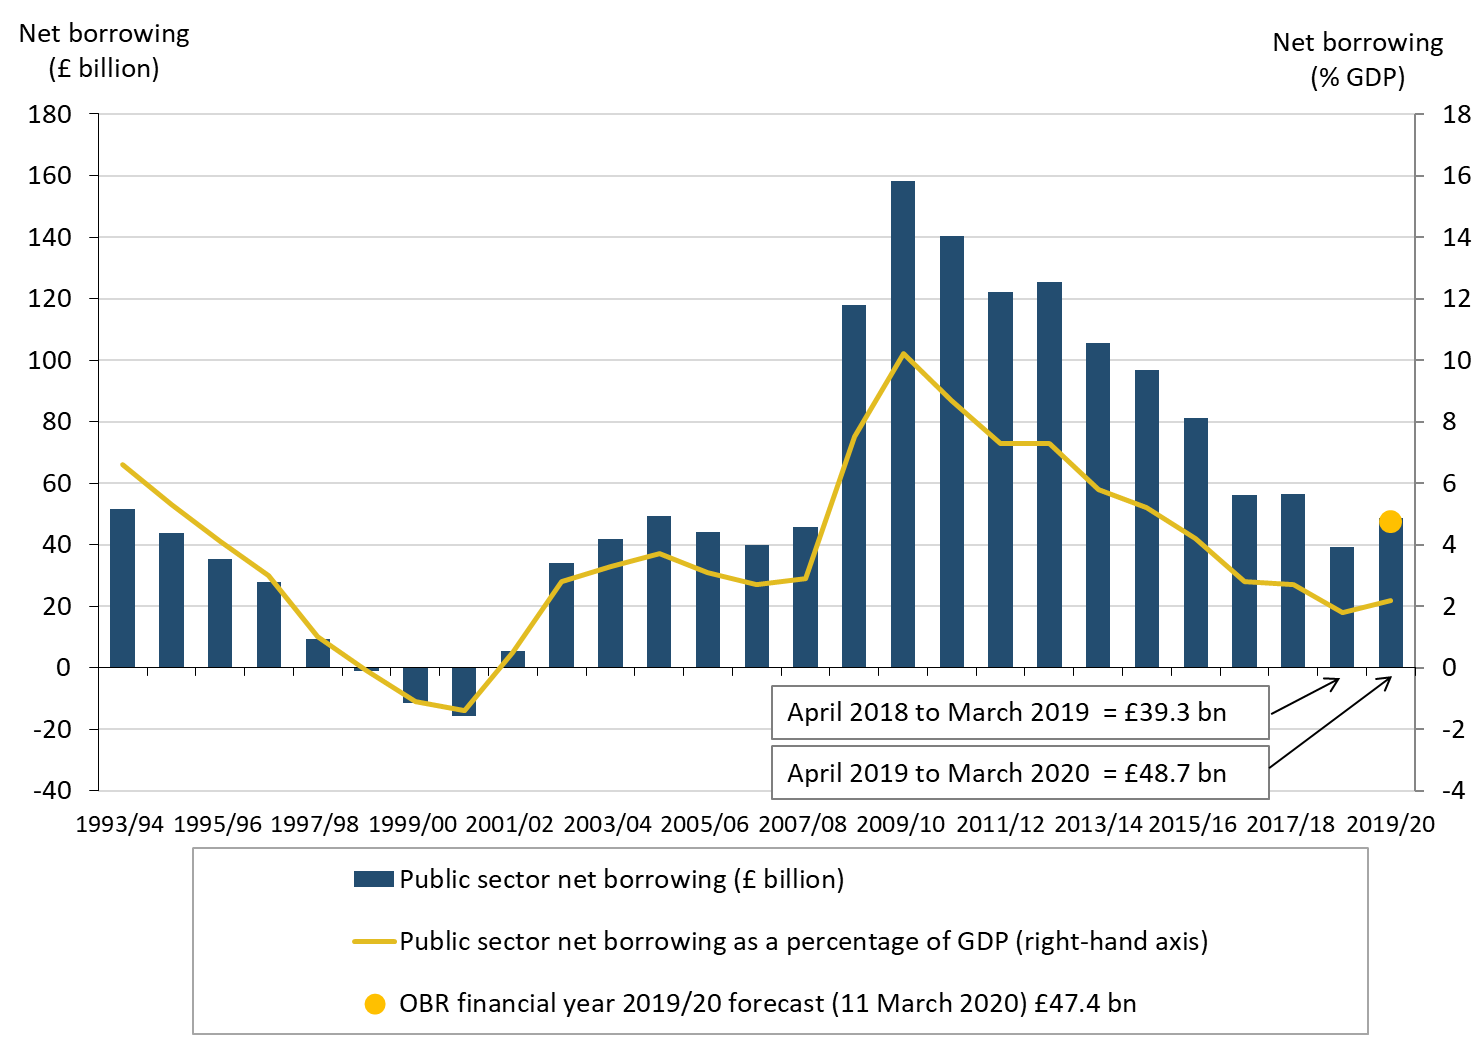
After higher borrowing in March 2020 than over the same period in recent years, borrowing in the latest full financial year ending March 2020 was £48.7 billion, £9.3 billion above that of the previous financial year and £1.3 billion more than forecast by the Office for Budget Responsibility (OBR) in their March 2020 Economic and fiscal outlook. Borrowing for the financial year as a whole is also likely to be revised up as more information about the impact of the COVID-19 pandemic becomes available.
Borrowing has generally been falling since its peak in the financial year ending March 2010. However, this year's £9.3 billion increase represents the largest year-on-year borrowing rise since this earlier peak.
Figure 2: Borrowing in the latest full financial year was £48.7 billion, £1.3 billion more than the Office for Budget Responsibility’s borrowing forecast of £47.4 billion
Public sector net borrowing excluding public sector banks, UK, cumulative full financial year (April 2019 to March 2020) compared with the financial year ending March 2019 (April 2018 to March 2019)
Source: Office for National Statistics – Public Sector Finances
Notes:
- The Office for Budget Responsibility (OBR) full financial year forecast of PSNB ex for the financial year ending March 2020, taken from the 11 March 2020 EFO.
Download this chart Figure 2: Borrowing in the latest full financial year was £48.7 billion, £1.3 billion more than the Office for Budget Responsibility’s borrowing forecast of £47.4 billion
Image .csv .xls6. Borrowing in March 2020
In March 2020, the public sector spent more money than it received in taxes and other income. Over this period, the public sector borrowed £3.1 billion, £3.9 billion more than it had to borrow in March 2019. Borrowing is likely to be revised up when improved data are available about the effect of the coronavirus (COVID-19) measures.
The difference between central government’s income and spending makes the largest contribution to the amount borrowed by the public sector.
In March 2020, central government borrowed £7.8 billion, while local government was in surplus by £3.8 billion. Additionally, the Bank of England’s (BoE’s) contribution to net borrowing was a surplus of £1.1 billion.
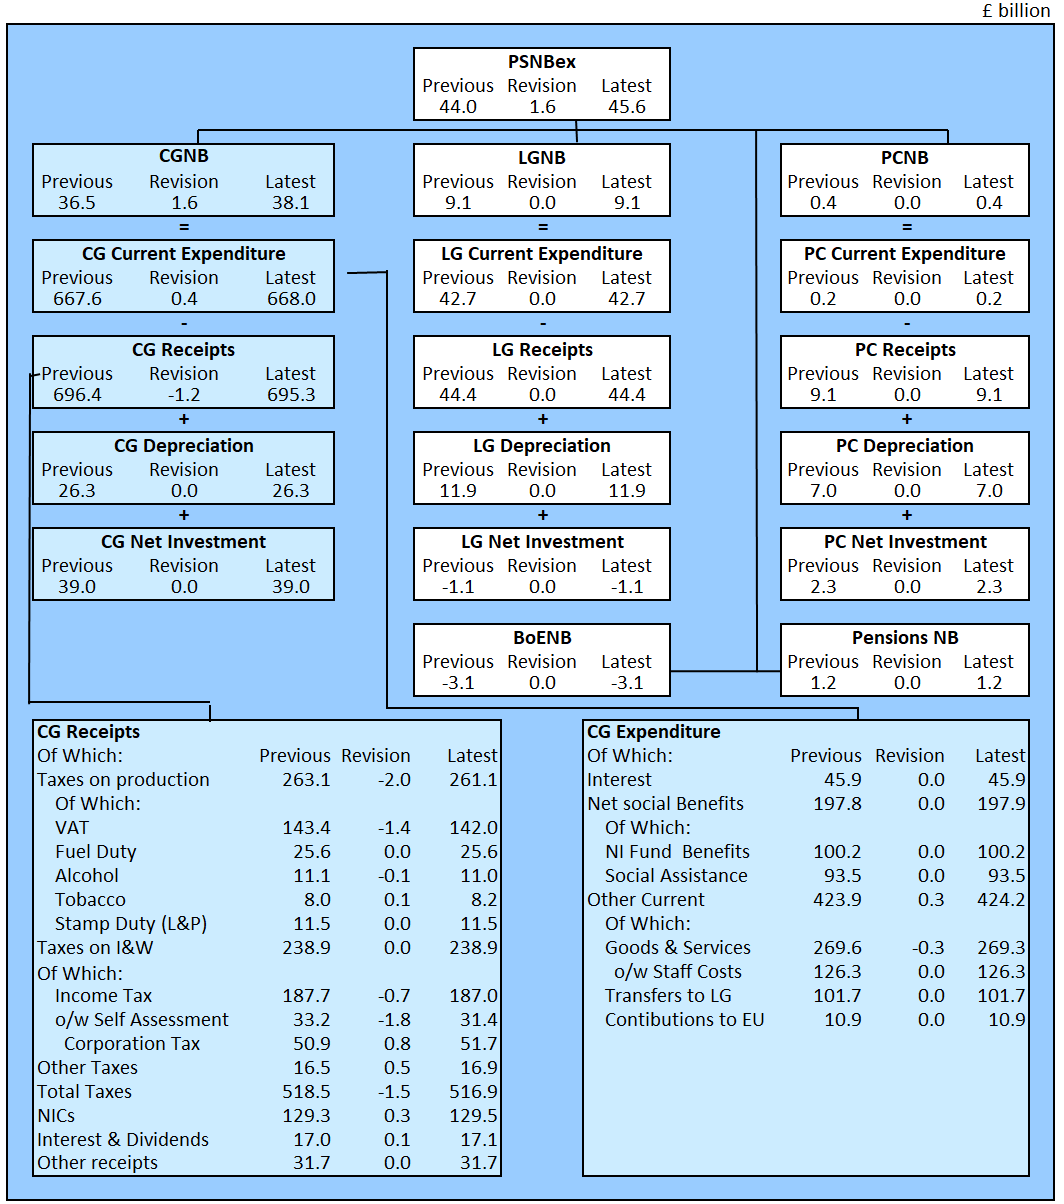
Figure 3 summarises how each of the five sub-sectors (central government, local government, non-financial public corporations, public sector pensions and the Bank of England (BoE)) contribute to the overall growth in monthly borrowing in March 2020 and compares this with the equivalent measures in the same month a year earlier (March 2019).
Figure 3: How each sector contributes to the growth in monthly borrowing
Public sector net borrowing by sub-sector, UK, March 2020, compared with March 2019

Source: Office for National Statistics – Public Sector Finances
Notes:
- PSNBex – Public sector net borrowing excluding public sector banks.
- CGNB – Central government net borrowing.
- LGNB – Local government net borrowing.
- PCNB – Non-financial public corporations: net borrowing.
- BoENB – Bank of England net borrowing.
- L&P – Land and property.
- I & W – Income and wealth.
- Contributions to EU – UK VAT, GNI and abatement contributions to the EU budget.
- NICs – National Insurance contributions.
- o/w – Of which.
Download this image Figure 3: How each sector contributes to the growth in monthly borrowing
.png (87.0 kB) .xls (94.2 kB)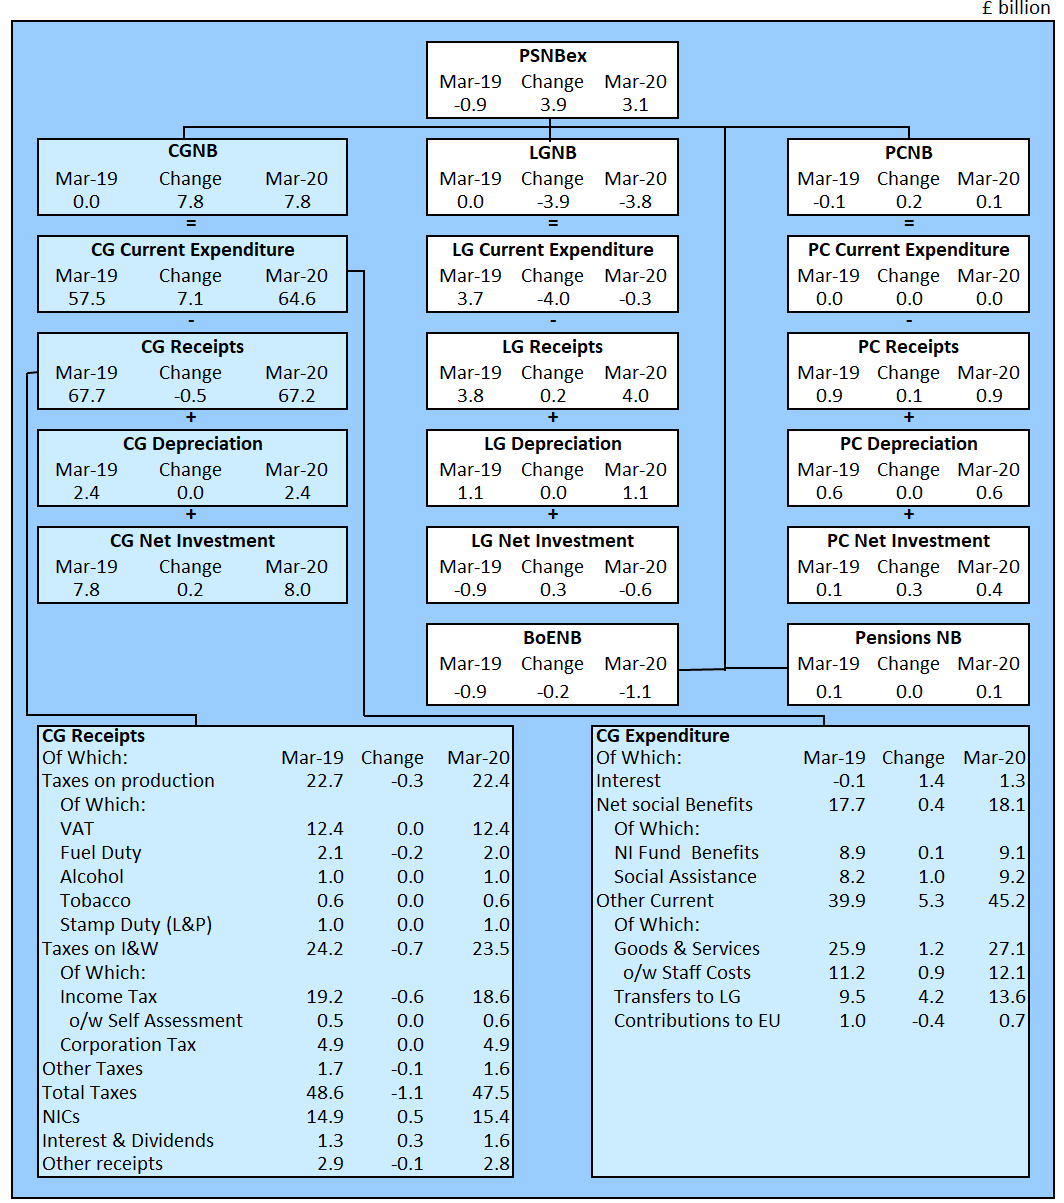
Central government receipts
In March 2020, central government receipts fell by 0.7% compared with March 2019 to £67.2 billion, including £47.5 billion in tax revenue.
These figures are subject to some uncertainty, as the accrued measures of both Value Added Tax (VAT) and Corporation Tax contain some forecast cash receipts data and are liable to revision when actual cash receipts data are received. In March 2020, both of these taxes were broadly level with the corresponding receipts a year earlier.
Central government expenditure
In March 2020, central government spent £72.6 billion, an increase of 11.2% on March 2019. Of this amount, around two-thirds was spent by central government on providing services and grants (for example, related to education, defence, and health and social care); just below one-third was spent on social benefits (such as pensions, unemployment payments, Child Benefit and Statutory Maternity Pay); and the remainder was spent on capital investment and interest on the government’s outstanding debt.
We have not yet included central government expenditure associated with the coronavirus job retention scheme, some of which is expected to relate to March 2020.
Departmental expenditure on goods and services
Departmental expenditure on goods and services in March 2020 increased by £1.2 billion compared with March 2019, including a £0.9 billion increase in expenditure on staff costs and a £0.6 billion increase in the purchase of goods and services. This increase in pay and procurement partially reflects that we have entered the first of the five years covered by the Department of Health and Social Care spending settlement.
UK contributions to the EU
The UK contribution to the EU in March 2020 was £0.7 billion, a decrease of £0.4 billion on March 2019. Monthly transactions are often affected by the timings of payments and so caution should be taken when drawing conclusions from monthly data. Over the 12 months making up the financial year ending March 2020, the UK contributed £1.3 billion less to the EU than it did in the previous financial year.
Current transfers from central to local government
In March 2020, central government transferred £13.6 billion to local government in the form of a current grant. This was £4.2 billion more than in March 2019, is mainly to fund additional support because of the COVID-19 pandemic, and represents the highest March transfer on record. While transfers from central government to local government increase central government’s borrowing, it reduces local government’s borrowing by an equal and offsetting amount and so has no borrowing impact at a public sector level.
Interest payments on the government’s outstanding debt
Interest payments on the government’s outstanding debt in March 2020 were £1.3 billion, a £1.4 billion increase compared with March 2019. Changes in debt interest are largely a result of movements in the Retail Prices Index (RPI) to which index-linked bonds are pegged.
Nôl i'r tabl cynnwys7. Borrowing in the latest financial year
This month we publish the first provisional estimate of borrowing for the full financial year ending March 2020. Between April 2019 and March 2020, the public sector borrowed a total of £48.7 billion, £9.3 billion (or 23.7%) more than in the same period the previous financial year. Of this £48.7 billion, £45.8 billion was borrowed by central government.
Central government receipts are estimated to have grown by £15.0 billion (or 2.0%), compared with the previous financial year, to £762.5 billion. Of this, tax receipts grew by £6.2 billion (or 1.1%) to £564.4 billion and National Insurance contributions grew by £7.6 billion (or 5.6%) to £144.9 billion.
Over the same period, central government spent £779.6 billion, an increase of £26.1 billion (or 3.5%). This increase was largely because of departmental expenditure on increase in pay and procurement partially reflecting the first of the five years covered by the Department of Health and Social Care (DHSC) spending settlement.
Figure 4 summarises how each of the five sub-sectors (central government, local government, non-financial public corporations, public sector pensions and the Bank of England (BoE)) contribute to the overall growth in monthly public sector net borrowing excluding public sector banks (PSNB ex) in the latest full financial year and compares this with the equivalent measures in the financial year ending March 2019.
Figure 4: How each sector contributes to the growth in borrowing
Public sector net borrowing by sub-sector, UK, latest full financial year (April 2019 to March 2020) compared with the financial year ending March 2019

Source: Office for National Statistics – Public Sector Finances
Notes:
- PSNBex – Public sector net borrowing excluding public sector banks.
- CGNB – Central government net borrowing.
- LGNB – Local government net borrowing.
- PCNB – Non-financial public corporations net borrowing.
- BoENB – Bank of England net borrowing.
- L&P – Land and property.
- I & W – Income and wealth.
- Contributions to EU – UK VAT, GNI and abatement contributions to the EU budget.
- NICs – National Insurance contributions.
- o/w – Of which.
Download this image Figure 4: How each sector contributes to the growth in borrowing
.png (98.2 kB) .xls (87.0 kB)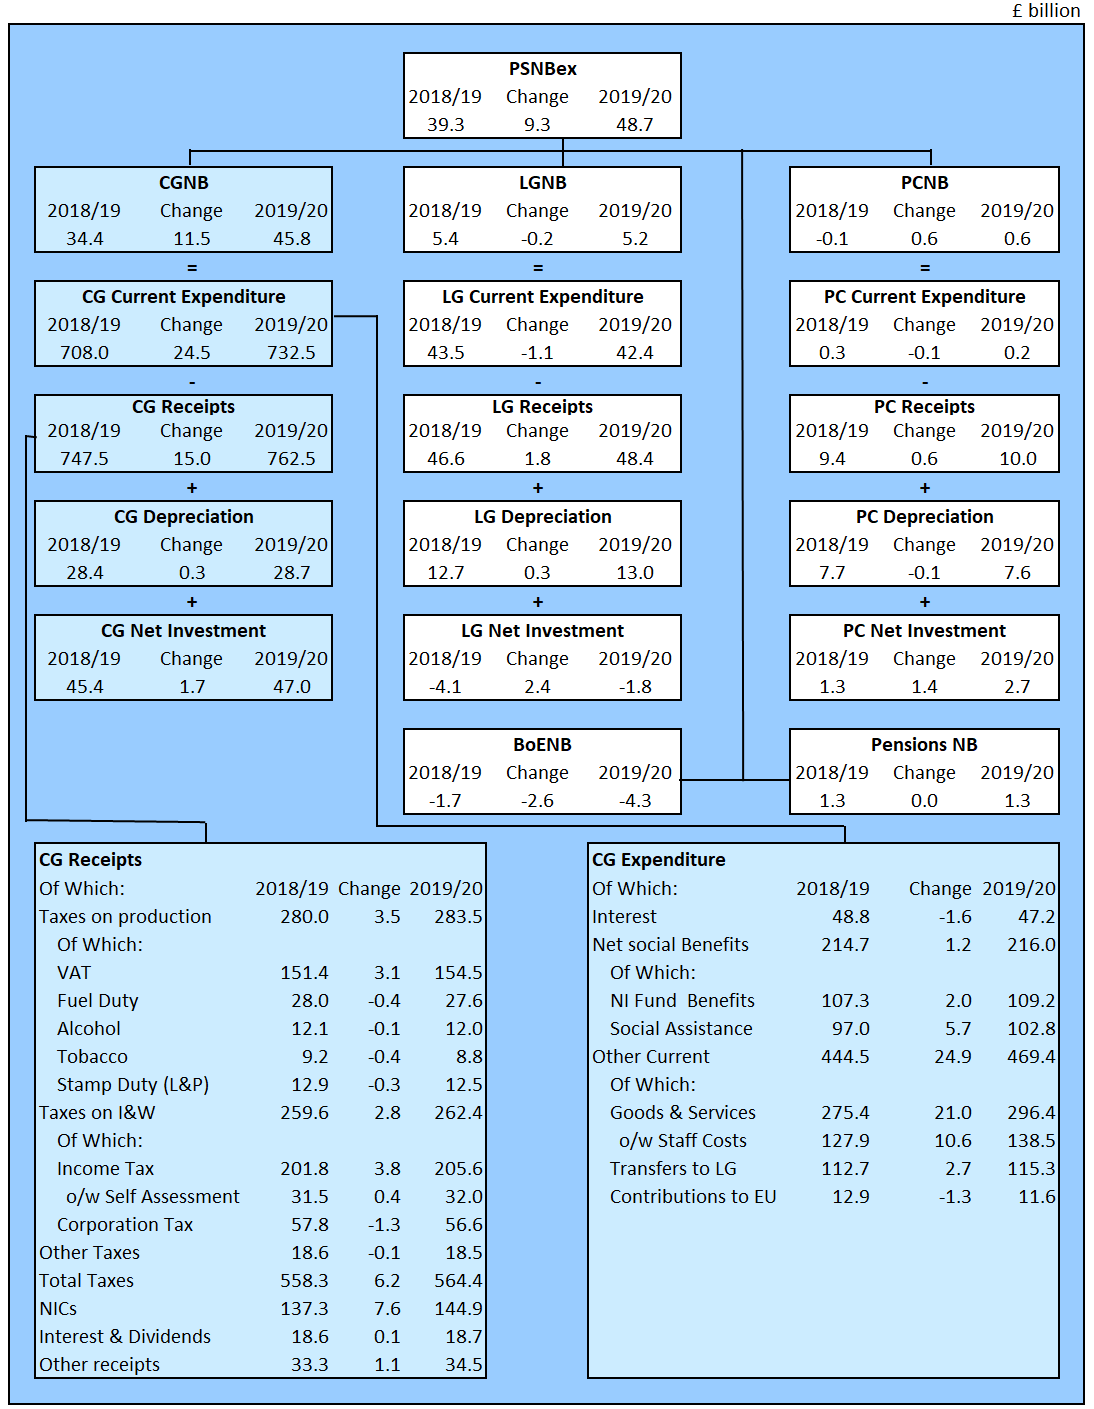
Borrowing in the latest full financial year was £48.7 billion (or 2.2% of gross domestic product (GDP)). Borrowing has generally been falling since its peak in the financial year ending March 2010, however, the latest financial year saw a 23.7% increase on the financial year ending March 2019.
Figure 5: Borrowing has generally been falling since its peak in the financial year ending March 2010
Public sector net borrowing excluding public sector banks, UK, April 1993 to March 2020
Source: Office for National Statistics – Public Sector Finances
Notes:
- The Office for Budget Responsibility (OBR) full financial year forecast of PSNB ex for the financial year ending March 2020, taken from the 11 March 2020 Economic and fiscal outlook.
- Financial year 2018 to 19 represents the financial year ending 2019 (April 2018 to March 2019).
- YTD equals year-to-date (April to March).
Download this image Figure 5: Borrowing has generally been falling since its peak in the financial year ending March 2010
.png (79.7 kB) .xls (86.0 kB)
8. Debt
At the end of March 2020, the amount of money owed by the public sector to the private sector stood at approximately £1.8 trillion (or £1,804.0 billion), which equates to 79.7% of gross domestic product (GDP). Though debt has increased by £30.5 billion on March 2019, the ratio of debt to GDP has decreased by 1.0 percentage point, as UK GDP has grown at a faster rate than debt over this period.
When the government borrows, this normally adds to the total debt, but it is important to remember that reducing the deficit is not the same as reducing the debt.
Figure 6: Debt as a percentage of gross domestic product (GDP) has been falling in recent financial years
Public sector net debt excluding public sector banks, UK, March 1994 to the end of March 2020

Source: Office for National Statistics – Public Sector Finances
Notes:
- Includes Asset Purchase Facility (APF), which includes the Term Funding Scheme (TFS).
- Public sector net debt excluding public sector banks (PSND ex) is the combination of PSND ex Bank of England (BoE) plus the BoE’s contribution to PSND ex.
- Financial year 2019 to 2020 represents the FYE 2020 (April 2019 to March 2020).
Download this image Figure 6: Debt as a percentage of gross domestic product (GDP) has been falling in recent financial years
.png (80.1 kB) .xls (73.7 kB)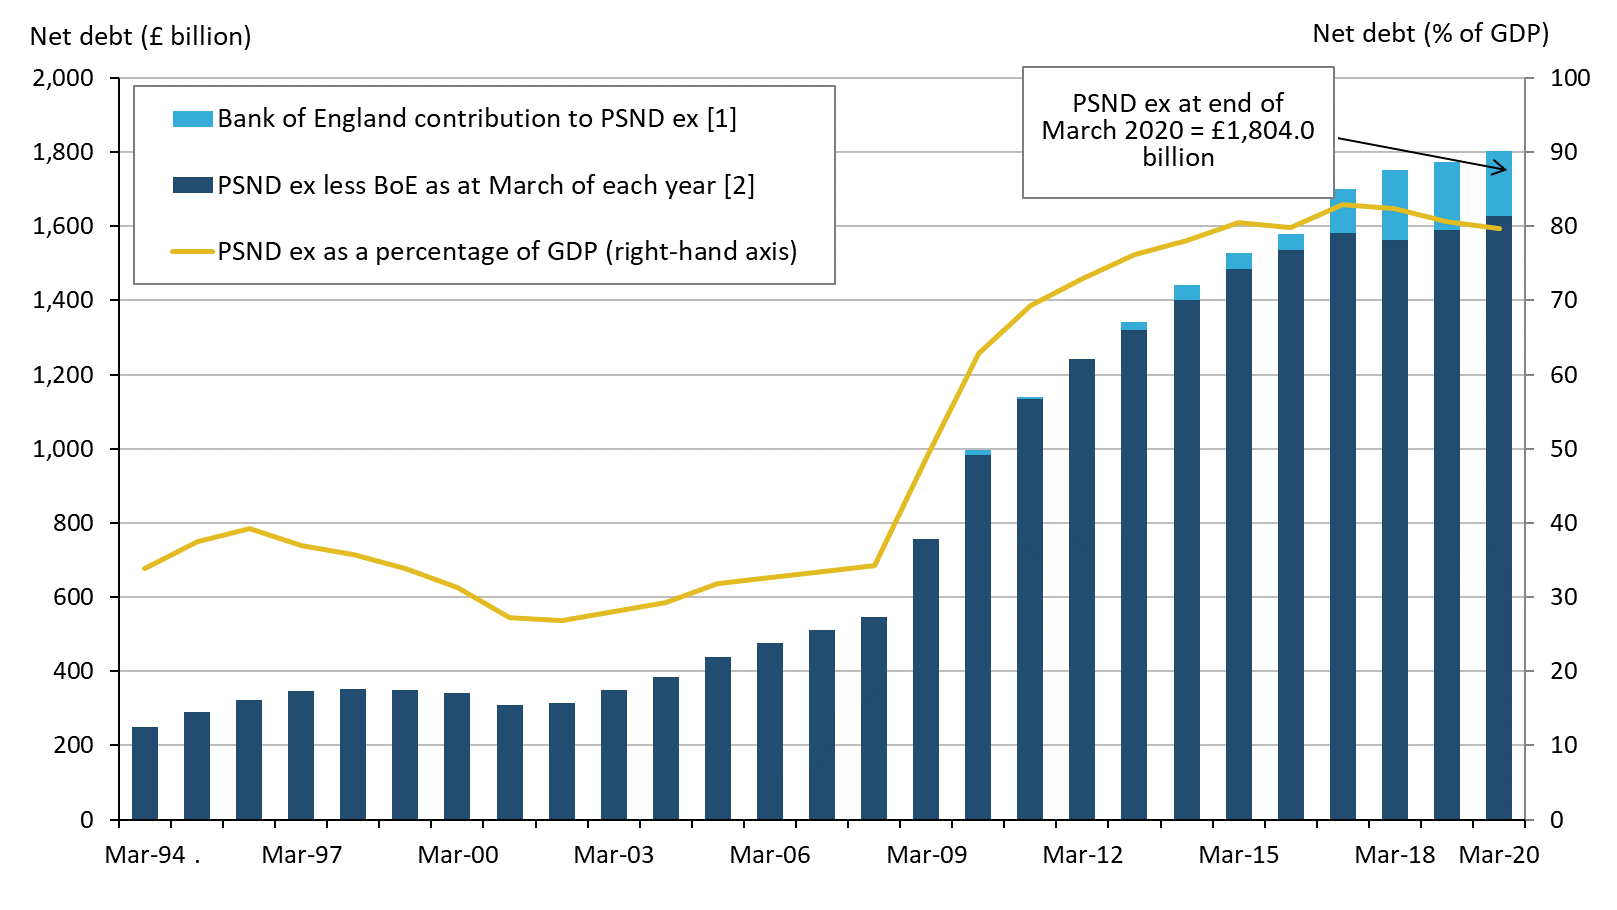
Debt at the end of March 2020 excluding the Bank of England (BoE) (mainly quantitative easing) was £1,627.5 billion (or 71.9% of GDP); this is an increase of £37.6 billion (or a decrease of 0.4 percentage points) on March 2019.
Nôl i'r tabl cynnwys9. Revisions
Table 1 shows the revisions to the headline statistics presented in this bulletin compared with those presented in the previous bulletin (published on 20 March 2020), while Figure 7 shows how each element of the public sector contributes to the revision in the current financial year-to-date net borrowing (public sector banks net borrowing excluding public sector banks, PSNB ex).
The data for the latest months of every release contain a degree of forecasts, subsequently these are replaced by improved forecasts as further data are available and finally outturn. The revisions presented in this section are largely the result of new tax data received from our data suppliers.
We have updated the estimates of gross domestic product (GDP) used to present a number of our measures, notably public sector net debt, as a percentage of GDP with the latest Office for National Statistics (ONS) figures (published 31 March 2020) and the official forecasts published by the Office for Budget Responsibility (OBR) (11 March 2020).
| £ billion¹ (not seasonally adjusted) | |||||||||
|---|---|---|---|---|---|---|---|---|---|
| Net borrowing | |||||||||
| Period | CG² | LG³ | NFPCs⁴ | PSP⁵ | BoE⁶ | PSNB ex⁷ | PSND ex⁸ | PSND % of GDP⁹ | PSNCR ex¹⁰ |
| 2016/17 | -0.1 | 0.0 | 0.0 | 0.0 | 0.0 | -0.1 | 0.0 | 0.0 | 0.0 |
| 2017/18 | 0.0 | 0.0 | 0.0 | 0.0 | 0.0 | 0.0 | 0.0 | 0.0 | 0.0 |
| 2018/19 | 0.4 | 0.0 | 0.0 | 0.0 | 0.0 | 0.4 | 0.0 | 0.0 | 0.0 |
| 2019/20 YTD¹² | 1.6 | 0.0 | 0.0 | 0.0 | 0.0 | 1.6 | 0.0 | 0.3 | 0.0 |
| 2019 Apr | 0.0 | -0.1 | 0.0 | 0.0 | 0.0 | 0.0 | 0.0 | 0.0 | 0.0 |
| 2019 May | 0.1 | -0.1 | 0.0 | 0.0 | 0.0 | 0.1 | 0.0 | 0.0 | 0.0 |
| 2019 Jun | 0.0 | 0.0 | 0.0 | 0.0 | 0.0 | 0.0 | 0.0 | 0.1 | 0.0 |
| 2019 Jul | -0.3 | 0.0 | 0.0 | 0.0 | 0.0 | -0.3 | 0.0 | 0.1 | 0.0 |
| 2019 Aug | -0.2 | -0.1 | 0.0 | 0.0 | 0.0 | -0.3 | 0.0 | 0.2 | 0.0 |
| 2019 Sep | -0.3 | -0.1 | 0.0 | 0.0 | 0.0 | -0.4 | 0.0 | 0.2 | 0.0 |
| 2019 Oct | -0.2 | 0.0 | 0.0 | 0.0 | 0.0 | -0.2 | 0.0 | 0.2 | 0.0 |
| 2019 Nov | 0.1 | 0.0 | 0.0 | 0.0 | 0.0 | 0.1 | 0.0 | 0.2 | 0.0 |
| 2019 Dec | 0.5 | 0.0 | 0.0 | 0.0 | 0.0 | 0.4 | 0.0 | 0.2 | 0.0 |
| 2020 Jan | 1.4 | 0.4 | -0.1 | 0.0 | 0.0 | 1.7 | 0.0 | 0.2 | 0.0 |
| 2020 Feb | 0.5 | -0.1 | 0.0 | 0.0 | 0.0 | 0.5 | 0.0 | 0.3 | 0.0 |
Download this table Table 1: Revisions to main aggregates
.xls .csv
Figure 7: How each element of the public sector contributes to the revision in financial year-to-date net borrowing (PSNB ex)
Revisions to borrowing since the previous public sector finances bulletin (published on 20 March 2020), UK
Source: Office for National Statistics – Public Sector Finances
Notes:
- PSNBex – Public sector net borrowing excluding public sector banks.
- CGNB – Central government net borrowing.
- LGNB – Local government net borrowing.
- PCNB – Non-financial public corporations net borrowing.
- BoENB – Bank of England net borrowing.
- L&P – Land and property.
- I & W – Income and wealth.
- Contributions to EU – UK VAT, GNI and abatement contributions to the EU budget.
- NICs – National Insurance contributions
- o/w – Of which.
Download this image Figure 7: How each element of the public sector contributes to the revision in financial year-to-date net borrowing (PSNB ex)
.png (87.1 kB) .xls (94.2 kB)
10. Public sector finances data
Public sector finances borrowing by sub-sector
Dataset | Released 23 April 2020
An extended breakdown of public sector borrowing in a matrix format and estimates of total managed expenditure (TME).
Public sector finances tables 1 to 10: Appendix A
Dataset | Released 23 April 2020
The data underlying the public sector finances statistical bulletin are presented in the tables PSA 1 to 10.
Public sector finances revisions analysis on main fiscal aggregates: Appendix C
Dataset | Released 23 April 2020
Revisions analysis for central government receipts, expenditure, net borrowing and net cash requirement statistics for the UK over the last five years.
Public sector current receipts: Appendix D
Dataset | Released 23 April 2020
A breakdown of UK public sector income by latest month, financial year-to-date and full financial year, with comparisons with the same period in the previous financial year.
Impact of student loans, public sector-funded pension scheme changes and capital consumption changes introduced in September 2019: Appendix G
Dataset | Released 23 April 2020
Latest estimates of public sector net borrowing (PSNB) (and further into current budget deficit and net investment spending), net debt and net financial liabilities, with the impacts of changes to the accounting for student loans, public sector pensions and capital consumption introduced in September 2019.
All datasets related to this publication are available on our website.
11. Glossary
The public sector
In the UK, the public sector consists of six sub-sectors: central government, local government, public non-financial corporations, public sector pensions, the Bank of England (BoE) and public financial corporations (or public sector banks).
Public sector current budget deficit
Public sector current budget is the difference between revenue (mainly from taxes) and current expenditure, on an accrued basis; it is the gap between current expenditure and current receipts (having taken account of depreciation). The current budget is in surplus when receipts are greater than expenditure.
Public sector net investment
Net investment refers to the balance of acquisition less disposals of capital assets and liabilities.
Public sector net borrowing
Public sector net borrowing excluding public sector banks (PSNB ex) measures the gap between revenue raised (current receipts) and total spending (current expenditure plus net investment (capital spending less capital receipts)). Public sector net borrowing (PSNB) is often referred to by commentators as "the deficit".
Public sector net cash requirement
The public sector net cash requirement (PSNCR) represents the cash needed to be raised from the financial markets over a period of time to finance the government's activities. This can be close to the deficit for the same period; however, there are some transactions, for example, loans to the private sector, that need to be financed but do not contribute to the deficit. It is also close but not identical to the changes in the level of net debt between two points in time.
Public sector net debt
Public sector net debt excluding public sector banks (PSND ex) represents the amount of money the public sector owes to private sector organisations including overseas institutions, largely as a result of issuing gilts and Treasury Bills, minus the amount of cash and other short-term assets it holds. Public sector net debt (PSND) is often referred to by commentators as "the national debt".
Debt interest to revenue ratio
The debt interest to revenue ratio (DIR) represents the proportion of net interest paid (gross interest paid less interest received) by the public sector (excluding public sector banks), compared with the non-interest receipts it receives in a given period.
Other important terms commonly used to describe public sector finances are listed in the Public sector finances glossary.
Nôl i'r tabl cynnwys12. Measuring the data
The Monthly statistics on the public sector finances: a methodological guide provides comprehensive contextual and methodological information concerning the monthly Public sector finances statistical bulletin. The guide sets out the conceptual and fiscal policy context for the bulletin, identifies the main fiscal measures, and explains how these are derived and interrelated. Additionally, it details the data sources used to compile the monthly estimates of the fiscal position.
More quality and methodology information on strengths, limitations, appropriate uses, and how the data were created is available in the Public sector finances QMI.
Departure from the EU
As the UK leaves the European Union (EU), it is important that our statistics continue to be of high quality and are internationally comparable. During the transition period, those UK statistics that align with EU practice and rules will continue to do so in the same way as before 31 January 2020.
These statistics, and our sector classification process, draw on the European System of Accounts (ESA) 2010, the Manual on Government Deficit and Debt, and associated guides.
After the transition period, we will continue to produce our public sector finance statistics in line with the UK Statistics Authority's Code of Practice for Statistics and in accordance with internationally agreed statistical guidance and standards.
To ensure comparability with other countries, the statistical aggregates within the Public sector finances release will continue to be produced according to the existing definitions and standards until further notice or those standards are updated.
Comparisons with official forecasts
The independent Office for Budget Responsibility (OBR) is responsible for the production of official forecasts for government. These forecasts are usually produced twice a year, in spring and autumn. Table 2 compares forecasts for the main fiscal aggregates published in the OBR's Economic and fiscal outlook (EFO) for March 2020 (11 March 2020) to provisional outturn.
Comparisons in this commentary with OBR forecasts, published on 11 March 2020, are unlikely to be particularly informative about the full year picture. The pre-measures forecast was closed in mid-February, when the impact of the coronavirus (COVID-19) on the UK looked likely to be limited, so it did not assume the sort of deterioration we might now expect in the final month of the year.
| £ billion, unless otherwise stated (not seasonally adjusted) | |||||
|---|---|---|---|---|---|
| Current Budget Deficit | Net investment | Net borrowing | Net debt¹ | Net debt % of GDP | |
| Outturn 2019/20 | -0.9 | 49.6 | 48.7 | 1,804.0 | 79.7 |
| OBR Forecast 2019/20² | -1.7 | 49.1 | 47.4 | 1,798.9 | 79.5 |
| Difference | 0.8 | 0.5 | 1.3 | 5.1 | 0.2 |
| OBR Forecast 2020/21² | -4.9 | 59.7 | 54.8 | 1,818.3 | 77.4 |
Download this table Table 2: How the latest outturn public sector figures compare to official OBR forecasts for the financial year ending March 2020, UK
.xls .csv13. Strengths and limitations
National Statistics status for public sector finances
On 20 June 2017, the UK Statistics Authority published a letter confirming the designation of the monthly Public sector finances bulletin as a National Statistic. This letter completes the 2015 assessment of public sector finances.
Local government
Local government data for the financial year ending (FYE) March 2020 are mainly based on budget data for England, Wales and Scotland, and estimates for Northern Ireland.
In recent years, planned expenditure initially reported in local authority budgets has been systematically higher than the final outturn expenditure reported in the audited accounts. We therefore include adjustments to reduce the amounts reported at the budget stage.
For the FYE March 2020, we include a £2.0 billion downward adjustment to England's current expenditure on goods and services, along with £0.7 billion and £0.2 billion adjustments to Scotland's and Wales' capital expenditure respectively. We apply a further £2.5 billion downward adjustment to current expenditure on benefits in the FYE March 2020, to reflect the most recently available data for housing benefits. Further information on these and additional adjustments can be found in the Public sector finances QMI.
Current and capital transfers between local and central government are based on administrative data supplied by HM Treasury. For this reason, data reported this month include grants made by central government to local authorities in respect of coronavirus (COVID-19) interventions, but do not yet include additional grants or reliefs paid by local authorities to households or businesses
Non-financial public corporations
Public corporations data for the FYE March 2020 remain initial estimates, based on the Office for Budget Responsibility (OBR) forecasts. Current and capital transfers between public corporations and central government are based on administrative data supplied by HM Treasury.
Public sector funded pensions
Pensions data for the FYE March 2020 are our estimates based on the latest available data. Some of these estimates rely on actuarial modelling; this is a complex process that most public sector schemes conduct every three to four years. Until such valuations become available, we forecast the change in pension liability using our knowledge of the economic climate. Pensions in the public sector finances: a methodological guide outlines both the theory and practice behind our calculation of pension scheme estimates.
Public sector banks
Unless otherwise stated, the figures quoted in this bulletin exclude public sector banks (that is, currently only Royal Bank of Scotland, RBS). The reported position of debt, and to a lesser extent borrowing, would be distorted by the inclusion of RBS's balance sheet (and transactions). This is because the government does not need to borrow to fund the debt of RBS, nor would surpluses achieved by RBS be passed on to the government, other than through any dividends paid as a result of the government equity holdings.
Nôl i'r tabl cynnwys