
Cynnwys
- Abstract
- Main points
- Things you need to know about this release
- Public service healthcare productivity overview
- Inputs
- Output quantity
- Output quality
- Revisions
- Healthcare productivity for England on a financial year basis
- Comparisons with other measures of output and productivity
- Acknowledgements
- Quality and Methodology
1. Abstract
This article contains updated estimates of output, inputs and productivity for public service healthcare in the UK between 1995 and 2014, and new estimates for 2015. Public service healthcare productivity is estimated by comparing the growth of service output with the growth of inputs used. Healthcare output is a measure of the quantity of healthcare delivered adjusted for the quality of delivery and is presented for separate healthcare sectors. Healthcare input is the quantity of labour, goods and services, and fixed capital consumption used in the provision of healthcare.
For the first time, this article also contains estimates of output, inputs and productivity for public service healthcare in England on a financial year basis.
Nôl i'r tabl cynnwys2. Main points
The average annual growth rate of UK public service healthcare productivity from 1995 to 2015 was 0.8% per year, as average annual output growth of 4.7% exceeded average annual input growth of 3.9%.
In 2015, public service healthcare productivity grew by 0.1% on the previous year, the slowest growth rate since 2009.
Output growth of 4.5% in 2015 was slightly slower than the previous year, largely due to slower growth in its largest component, hospital and community health services.
Input growth of 4.4% in 2015 was faster than the previous year, partly driven by an increase in the growth rate of NHS purchases of care from non-NHS providers, which also raises output.
The quality adjustment added 0.2 percentage points to output growth in 2015, slightly lower than both the previous year’s figure and the average rate for the series.
Non-quality adjusted productivity fell by 0.2% in 2015, in contrast with average annual non-quality adjusted productivity growth of 0.4% between 1995 and 2015.
3. Things you need to know about this release
This article introduces the concepts of productivity, gives an overview of the trends in UK public service healthcare productivity between 1995 and 2015, and provides more detail on composition of the output and input measures used in calculating productivity1.
Public service healthcare productivity is estimated by comparing growth in the total quantity of healthcare output provided (adjusted for quality) with growth in the total quantity of inputs used. If the growth rate of output exceeds the growth rate of inputs, productivity increases, meaning that more output is being produced for each unit of input. Conversely, if the growth rate of inputs exceeds the growth rate of output, then productivity will fall, indicating that less output is being produced for each unit of input.
Whilst these productivity estimates provide a measure of the amount of output that is produced for each unit of input, they do not measure value for money or the wider performance of public healthcare services. They do not indicate, for example, whether the inputs have been purchased at the lowest possible cost, or whether the desired outcomes are achieved through the output provided.
Healthcare output is the quantity of healthcare provided adjusted for the quality of delivery. The quantity output is measured as the cost-weighted number of individual healthcare activities performed and can also be described as volume output. The quality of delivery is measured using a combination of indicators including estimated health gain, survival rates, waiting times, primary care outcomes and results from the National Patient Surveys. The data for estimated health gain, survival rates and waiting times are provided by the Centre for Health Economics at the University of York, who also use the data in a separate series of healthcare productivity statistics, the Productivity of the English NHS (PDF, 3.24MB). A discussion of the differences between this productivity measure and the Office for National Statistics (ONS) productivity series can be found in section 10.
Healthcare inputs are composed of labour (measured as full-time equivalent staff numbers), goods and services, and consumption of fixed capital. Further information on methods, including information about data used for the different constituent countries of the UK and how these are aggregated to form a UK index, is available in our sources and methods paper (PDF, 328.65KB).
We are currently undertaking a development programme to improve public service productivity statistics across all service sectors, and as a result, a number of developments have been incorporated into the measurement of inputs, output and productivity in this publication. More information on revisions can be found in the revisions section.
It should be noted that the quantity output figures included in this release differ from figures in the UK National Accounts, The Blue Book. This is partly because of:
- the incorporation of a number of methods improvements affecting output data in this release for each of England and Wales between financial year ending (FYE) 2013 and FYE 2015
- differences in the deflator used to calculate non-NHS output growth
- the incorporation of an updated method for converting financial year data into calendar years for the data in this release
The methods improvements affecting output data for England and Wales are intended to be incorporated into the June edition of the Quarterly National Accounts and into the 2018 Blue Book. These differences are noted in the December edition of the Quarterly National Accounts.
These estimates form part of Public service productivity estimates, total public service: 2015, which also provides details of productivity in other public service sectors.
Notes for: Things you need to know about this release
- Productivity estimates included in this article are multi-factor productivity estimates as opposed to labour productivity estimates. This is because the inputs used include goods and services, and capital inputs, in addition to labour input. However, the public service productivity measures included in this article are not comparable with ONS whole economy multi-factor productivity estimates due to differences in the definitions used. For more information on these differences, see the article on Comparing public service productivity estimates with other productivity estimates.
4. Public service healthcare productivity overview
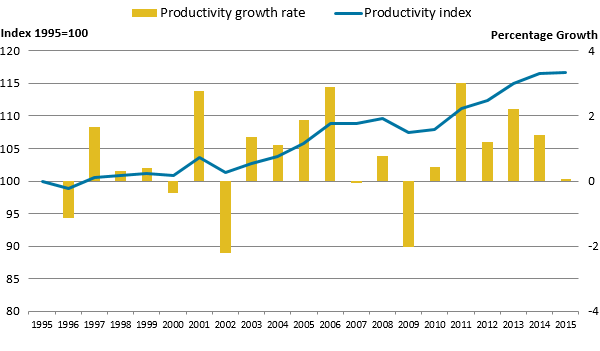
Figure 1a: Public service healthcare productivity index and growth rate, UK, 1995 to 2015
Source: Office for National Statistics
Download this image Figure 1a: Public service healthcare productivity index and growth rate, UK, 1995 to 2015
.png (16.7 kB) .xls (20.5 kB)
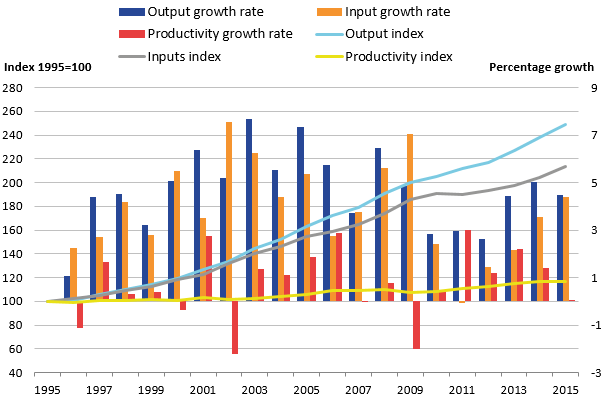
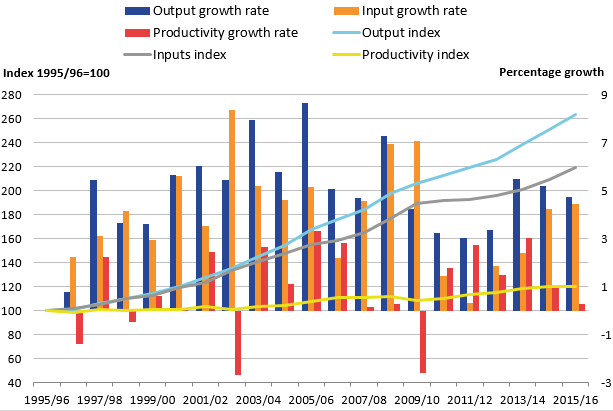
Figure 1b: Public service healthcare output, inputs and productivity indices and growth rates, UK, 1995 to 2015
Source: Office for National Statistics
Download this image Figure 1b: Public service healthcare output, inputs and productivity indices and growth rates, UK, 1995 to 2015
.PNG (34.0 kB) .xls (21.0 kB)
Figure 1b shows trends in public service healthcare output, inputs and productivity between 1995 and 2015. Annual growth rates for these three series are shown as bars (measured against the right axis) while the cumulative changes in the three series since 1995 are shown by the lines (measured against the left axis and indexed to a level of 100 in 1995).
Figure 1b shows that public service healthcare productivity rose by 0.1% in 20151. This was due to output growing at 4.5%, while inputs grew at a lower rate of 4.4%2. While this means 2015 saw a sixth consecutive year of rising public service healthcare productivity, growth in 2015 was lower than the average for the whole series of 0.8%3 and was the lowest productivity growth rate since 2009.
Public service healthcare productivity over 20 years
With the addition of 2015 data, the time series for public service healthcare productivity has extended to a 20-year period.
Viewing the trends over the period, it can be noted that the majority of healthcare productivity growth occurred during two periods – between 2002 and 2006, and between 2009 and 2015.
During this latter period, the increase in productivity began as, while the growth rate of both output and inputs slowed considerably between 2009 and 2011, the growth rate of output slowed by less than the growth of inputs. Productivity increased further between 2011 and 2015, as the growth rate of both output and inputs increased, but with output continuing to grow more quickly.
Public service healthcare productivity was 16.6% higher in 2015 than in 1995, meaning that 16.6% more healthcare output was provided for each unit of input in 2015 than in 1995.
When analysing productivity over the whole series, it should be noted that output was not quality adjusted between 1995 and 2000. Section 7 provides more information on the effect of quality adjustment.
Notes for: Public service healthcare productivity overview
- Growth rates for each year are given as the growth between the stated year and previous year. For example, the growth figure for 2015 is the growth measured between 2014 and 2015.
- While productivity growth is calculated using the difference between output and input growth, productivity growth is calculated using unrounded data and therefore the productivity growth figures in this article may differ from figures calculated using rounded output and input growth rates.
- Average growth rates for cumulative growth across multiple years are geometric means.
5. Inputs
Inputs to publicly-funded healthcare are broken down into three components:
- labour – such as hospital consultants, registrars, nurses, technical staff, ambulance staff, support staff, General Medical Practitioners (GPs) and GP practice staff
- goods and services – such as non-staff costs of pharmaceutical services, dental and ophthalmic services, and the purchase of equipment by hospitals and GP practices including items such as gloves and syringes; this component also includes GP-prescribed drugs, services provided by non-NHS organisations and agency staff costs
- consumption of fixed capital – capital consumption covers the cost of depreciation of capital goods (items that are anticipated to be in use over several years and add to the stock of resources in the healthcare system, such as buildings and vehicles) over time
Estimates of labour inputs are based on direct measurement of the change in the number of full-time equivalent employees of the health service, weighted by their average earnings. Inputs for goods and services are estimated indirectly, using appropriate deflators for each sub-component, to remove the effects of price changes from current price expenditure. Capital consumption is measured using the perpetual inventory method, as used in the UK National Accounts.
To produce a measure for total inputs, the growth rates of the three input components are weighted by their share of total expenditure and then combined.
We are currently undertaking a development programme across public service productivity statistics and as part of this, there are several improvements to the methodology for calculating labour and goods and services inputs incorporated in this publication. These changes have been applied across the historical time series as far back as data series enable, resulting in some differences in the series included in this publication compared with the previous year’s publication. More information about these revisions can be found in the revisions section.
Figure 2a shows the inputs growth by component before it is weighted by expenditure share. Figure 2b presents this information after weighting, showing how growth in each component contributes to the growth in overall inputs. These charts show that the rate of growth of total inputs increased for a fourth consecutive year to 4.4% in 2015, its highest growth rate since 2009.
Figure 2a: Public service healthcare inputs quantity growth by component, UK, 1996 to 2015
Source: Office for National Statistics
Notes:
- Capital growth was not included in Figure 2a, due to its small expenditure weight, and therefore small impact on total inputs (see Figure 2b).
Download this chart Figure 2a: Public service healthcare inputs quantity growth by component, UK, 1996 to 2015
Image .csv .xls
Figure 2b: Public service healthcare contributions to inputs growth by component, UK, 1996 to 2015
Source: Office for National Statistics
Download this chart Figure 2b: Public service healthcare contributions to inputs growth by component, UK, 1996 to 2015
Image .csv .xlsAs healthcare inputs are calculated using a combination of a quantity labour measure and deflated expenditure and capital consumption, inputs growth is dependent on a combination of factors in addition to changes in cash spending.
The increase in inputs growth in 2015 was driven by faster growth in goods and services inputs procured which, as shown by Figure 2a, have grown faster than labour inputs in every year of the series except 2004.
Goods and services inputs grew at 6.7% in 2015. While roughly in line with an average growth rate of 6.5% over the whole period 1995 to 2015, this is higher than the relatively slow growth in the immediately preceding years, and up from growth of 4.6% in 2014.
Two important drivers of this increased growth in inputs are: increased NHS expenditure on purchases of care from non-NHS providers1 in 2015; and lower inflation in the deflator produced from the Health Service Cost Index2, which had a growth rate of negative 0.1% in financial year ending 2016. This deflator is one of several series used in the calculation of inputs growth and is used to deflate most spending on goods and services by NHS trusts and foundation trusts.
While strong, positive inflation will result in the quantity of goods and services inputs growing much more slowly than current price spending on goods and services, lower or negative deflators will result in faster growth in the quantity of goods and services inputs for any given rate of current price spending growth.
While goods and services has provided the largest contribution to growth over the period 1995 to 2015, labour inputs also contributed to the growth rate. Labour inputs grew at 2.2% in 2015, slightly slower than the growth rate of 2.6% in 2014, but in line with the average growth over the whole period 1995 to 2015.
The third component of inputs is capital consumption, which grew at an average annual rate of 0.4% over the period 1995 to 2015. Due to its small share of total expenditure, capital consumption has a limited effect on the change in total inputs and so growth in capital consumption is not included in Figure 2a, but is included in Figure 2b.
Healthcare inputs over 20 years
Public service healthcare inputs grew in every year of the series, with the exception of 2011, where it fell by 0.1%. The annual average growth rate of inputs from 1995 to 2015 was 3.9%, leaving total inputs 2.1 times higher in 2015 than in 1995.
Figure 2b shows that goods and services growth contributed the majority of input growth in every year of the series except 2004.
The contribution of each of the three components to overall input growth is determined by a combination of the growth rate of each input component and its share of total expenditure, also known as its weight3. There has been a shift over time as the expenditure share of goods and services has increased from 35% in 1995 to 51% in 2015, while the expenditure share of labour has fallen from 61% to 47% over the same period. However, it should be noted that the goods and services category includes non-NHS expenditure and agency staff, which have experienced greater growth than most types of input and so account for much of this shift over time.
The expenditure share of capital consumption has remained relatively small throughout the series.
Data for volume growth, expenditure shares and contributions to growth by component for public service healthcare inputs are available in the dataset accompanying this release.
Notes for: Inputs
- NHS expenditure on purchases of care from non-NHS providers includes a variety of services procured from independent sector providers, such as hospital services and home care services.
- The Health Service Cost Index was published by the Department of Health until 2017 and measures inflation in a basket of goods and services used in the health service. Caution should be taken in interpreting this index as a specific inflation rate for the NHS, as much of the price data are drawn from the general retail prices of goods and services used in the NHS, as opposed to the specific prices paid by NHS organisations. In addition, the index used in the inputs calculations differs from the overall published index, as we use a modified version of the index, which excludes elements that are considered to be capital inputs. Capital inputs are deflated separately using an implied deflator derived from the UK National Accounts.
- The measure of total inputs is aggregated from its sub-components using a Laspeyres index. To calculate a Laspeyres index, expenditure shares from the previous year are used and are therefore reported here. For more information, see Methodology notes: annual chain-linking (PDF, 58.02KB).
6. Output quantity
Healthcare output is measured as the quantity of healthcare delivered adjusted for changes in the quality of delivery. The quantity measure of output is estimated using a cost-weighted activity index and can alternatively be described as volume output. To produce this measure, the growth rates for thousands of individual healthcare activities are calculated and then weighted by their proportion of total expenditure. As a result, growth in treatments that are high-volume and expensive has a greater effect on the output index than a similar rate of growth in treatments that are uncommon and low-cost.
The quantity of healthcare is estimated separately for each of the following sectors, which are weighted together to produce an overall quantity output series:
- Hospital and Community Health Services (HCHS) – includes hospital inpatient, outpatient and day case episodes
- Family Health Services (FHS) – includes General Practitioner (GP) and practice nurse consultations, publicly-funded dental treatment and sight tests
- GP prescribing – includes all drugs prescribed by General Practitioners
- non-NHS provision – includes services funded by the government but provided by the private or third sector
In previous publications of public service productivity estimates, the output measure for NHS-provided services used in the calculation of public service productivity has been the same as that included in the UK National Accounts, The Blue Book. However, the outputs used in this analysis differ from those in the most recent Blue Book, because:
- a number of methods improvements affecting output data for each of England and Wales between financial year ending (FYE) 2013 and FYE 2015
- incorporation of an updated method for converting financial year data into calendar years
More information about these changes can be found in the revisions section.
In 2015, public service healthcare quantity output (excluding quality adjustment) grew by 4.2%, a slightly lower rate than in 2014 when it grew at 4.4%. Recent quantity output growth is similar to the average growth rate of 4.3% over the period 1995 to 2015.
Figure 3a shows the quantity output growth by component before it is weighted by expenditure share. Figure 3b presents this information after weighting each of the four components together to show how much growth in each component contributes to the growth in overall output quantity.
Figure 3a: Public service healthcare quantity output growth by component, UK, 1996 to 2015
Source: Office for National Statistics
Notes:
- HCHS – Hospital and Community Health Services.
- FHS – Family Health Services.
Download this chart Figure 3a: Public service healthcare quantity output growth by component, UK, 1996 to 2015
Image .csv .xls
Figure 3b: Public service healthcare contributions to quantity output growth by component, UK, 1996 to 2015
Source: Office for National Statistics
Notes:
- HCHS – Hospital and Community Health Services.
- FHS – Family Health Services.
- The sum of components of quantity output may not equal total output as the components and total output are independently splined to convert the data from financial to calendar year.
Download this chart Figure 3b: Public service healthcare contributions to quantity output growth by component, UK, 1996 to 2015
Image .csv .xlsFigure 3a shows that the quantity output from HCHS has grown in every year of the measured time series, averaging a growth rate of 3.3% per year.
In 2015, growth in the quantity of HCHS output was 2.9%, following two years of growth of approximately 4.5%. The slower growth rate was driven by slower growth in England in elective inpatients and day cases – one of the largest components by spending; and to a lesser extent by lower growth in chemotherapy, radiotherapy and high-cost drugs output after several years of high growth in these categories.
Growth in the output of FHS has generally been lower than the other components of healthcare output over the period, with an average growth rate of 1.9% between 1995 and 2015. FHS output grew by 2.2% in 2015, maintaining the relatively stable growth rate observed since 2010.
There was a steady downward trend in the growth rate of GP-prescribed drugs over the series, from a maximum of 14.3% in 2000 to 3.2% in 2011, after which it has levelled out. Growth in this component was 3.6% in 2015, a similar rate to recent years.
The final component of healthcare output is non-NHS provision. In contrast with the other components of output, a lack of detailed data on non-NHS activity means this component is measured using deflated expenditure, an approach also known as the “output-equals-inputs” method. Growth in non-NHS provision was relatively volatile in the early years of the series and grew particularly quickly over the period 1996 to 2009, when it averaged 15.5% per year. Growth between 2009 and 2014 has been steadier, averaging 7.3% per year, but 2015 saw faster growth of 16.4%, the highest since 2007.
Figure 3b shows the contributions to overall quantity output growth from the four components. The contributions to growth depend both on the rate of output growth of each component and the proportion of spending the component accounts for, known as the component’s weight. In 2015, the majority of growth was attributed to HCHS spending, which was the largest component by spending with a weight of 65%, and non-NHS provision, which had a smaller expenditure weight of 11%, but a faster growth rate.
Healthcare quantity output over 20 years
Public service healthcare quantity output grew in all years across the series and was more than 2.3 times greater in 2015 than 1995. Quantity output growth averaged 4.7% between 1995 and 2009, before falling to an average of 2.5% between 2009 and 2012. This average growth rate was higher between 2012 and 2015 at 4.2%, driven primarily by increasing HCHS output between 2012 to 2014 and by both HCHS and non-NHS output in 2015.
Growth in the quantity of healthcare provided should be seen in the context of healthcare demand and its drivers. One of these drivers is an ageing population: while the total UK population grew at an annual average of 0.6% over the period 1995 to 2015, the population aged 75 and over grew at 1.3%. However, research by bodies such as the Organisation for Economic Co-operation and Development suggests that demographic effects, such as a larger population and an increasing number of people aged 75 and over, have a relatively small impact on healthcare expenditure and output growth. Factors such as medical advances, healthcare institutions and public expectations are viewed as more significant factors in explaining increases in healthcare expenditure over time (see Public spending on health and long-term care: a new set of projections for more information).
Data for quantity growth, expenditure shares and contributions to growth by component for public service healthcare quantity output are available in the dataset accompanying this release.
Notes for: Output quantity
- Non-NHS provision is measured indirectly using expenditure and uses the “output-equals-inputs” convention, meaning implicit productivity for the non-NHS component is zero.
7. Output quality
In line with the recommendations of the Atkinson Review (PDF, 1.08MB), a quality adjustment is applied to the estimate of healthcare quantity output1. The adjustment reflects two dimensions of quality:
- the extent to which the service succeeds in delivering its intended outcomes: for HCHS services, this is measured using short-term survival rates2, health gain following treatment in hospital and changes in waiting times; and for primary care, this is measured with a selection of measures from the GP Quality and Outcomes Framework, including measures for the percentage of certain groups of patients meeting target ranges for blood pressure
- the extent to which the service is responsive to users’ needs: National Patient Survey results are used to measure patient experience of hospital inpatient services, mental health services, primary care, outpatient, and accident and emergency services
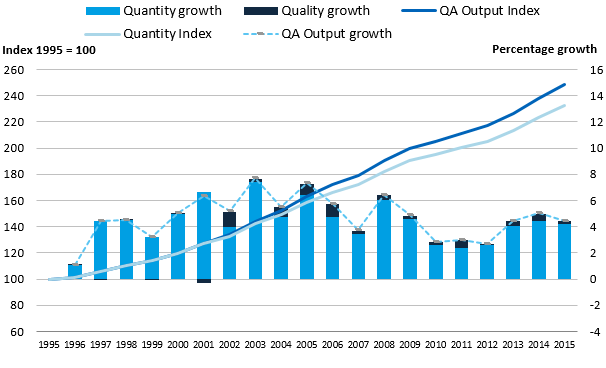
Figure 4 shows growth in the quantity and quality measures of healthcare output.
Figure 4: Public service healthcare quantity and quality-adjusted output indices and growth rates, UK, 1995 to 2015
Source: Office for National Statistics
Notes:
- QA – quality adjusted.
- Sum of components of output may not equal total output due to the method for splining data from financial to calendar year.
Download this image Figure 4: Public service healthcare quantity and quality-adjusted output indices and growth rates, UK, 1995 to 2015
.PNG (26.2 kB) .xls (28.2 kB)
The impact of the quality adjustment was positive in all years, with the exception of a small negative impact in 2001, the first year it was applied. In 2015, the quality adjustment added 0.2 percentage points to the output growth rate. This was lower than the quality adjustment of 0.6 percentage points in 2014 and lower than the average adjustment for the period 2000 to 2015 of 0.4 percentage points.
Effect of quality adjustment on productivity
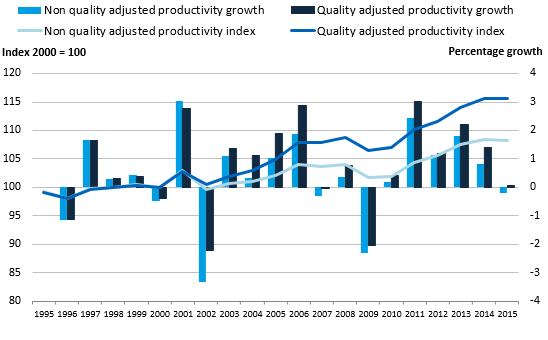
Figure 5 shows the growth of healthcare productivity with and without the quality adjustment applied, with total growth indexed to 2000, the year before the quality adjustment was introduced. This shows that the quality adjustment has had a positive effect on productivity over the series and accounted for over 40% of the overall increase in healthcare productivity between 2000 and 2015. The gap between quality adjusted and non-quality adjusted productivity has widened steadily over the period. This has occurred because, while the effect of quality adjustment on annual output growth has been small, the quality adjustment has been positive in every year except 2001.
Figure 5 shows that, while quality-adjusted productivity grew for the sixth consecutive year, non-quality adjusted productivity fell by 0.2%3 in 2015 as a result of quantity output growing more slowly than quantity inputs.
Over the period 2000 to 2015, quality-adjusted productivity grew at an average rate of 1.0% and non-quality adjusted productivity grew at an average rate of 0.5%.
Figure 5: Public service healthcare quantity and quality-adjusted productivity indices and growth rates, UK, 1995 to 2015
Source: Office for National Statistics
Download this image Figure 5: Public service healthcare quantity and quality-adjusted productivity indices and growth rates, UK, 1995 to 2015
.PNG (19.2 kB) .xls (26.1 kB)
Data for public service healthcare inputs, quantity and quality adjusted output and productivity are available in the dataset accompanying this release.
Notes for: Output quality
- No quality adjustment is currently applied to non-NHS services.
- The quality adjustment for short-term survival rates is calculated from data supplied by the University of York on a financial year basis and between the years FYE 2001 to FYE 2014 was measured by the year-on-year change in 30-day post-operative mortality. However, these data are no longer available and so the short-term survival rate adjustment for the period FYE 2014 to FYE 2016 is measured using the change in in-hospital mortality rates.
- The difference in growth between quality-adjusted and non-quality adjusted productivity may not equal the quality adjustment in that year at the one decimal point level, due to rounding.
8. Revisions
We are currently undertaking a development programme to improve public service productivity statistics across all service sectors and to produce new measures and analyses of public service efficiency.
As part of this programme, several developments have been incorporated into the measurement of inputs, output and productivity in this publication and further developments are planned for future years.
As a result of these developments, as well as the incorporation of updated source data, these series differ slightly from those previously published in Public service productivity estimates: healthcare, 2014 for the years 1995 to 2014.
The following section provides detail on the sources of the revisions.
Input revisions
Revisions to the inputs series resulted from both updated source data and methodological improvements.
Updated source data
Updated source data were included for the following elements:
- national accounts spending data used to weight together the three input components – labour, goods and services, and capital consumption
- capital consumption data drawn from the national accounts
- updated data for agency staff spending, pharmaceutical services, prescription fees and private income
Methodological developments
Table 1 details the methodological improvements to inputs and their various effects.
Table 1: Methodological improvements to inputs
| Methods change | Detail of change | Effect of change |
|---|---|---|
| Conversion of financial year data to calendar year ("cubic splining") | To convert financial year data into calendar year, a technique known as cubic splining splits annual financial year volume or spending data into quarterly data, which are then re-aggregated to create calendar year figures. For this year’s publication, the method used has been updated from X-11 ARIMA to X-13 ARIMA in line with latest national accounts practices. X-13 ARIMA has improved methods for forecasting and backcasting data as well as interpolating a trend within a data series. | As a result of incorporating this change, some of the annual growth rates have changed as the volume of output and input calculated from financial data has been apportioned between calendar years in a slightly different manner. |
| Change in data source for Hospital and Community Health Services (HCHS) staff numbers in England | Previously, full-time equivalent (FTE) numbers used to calculate the HCHS labour inputs for England were derived from the workforce census taken annually at 30 September. This data collection has now ceased and data are now taken from the HCHS monthly
workforce statistics, using the average FTE numbers for each staff category over a 12-month period. This dataset has a slightly more detailed categorisation of staff by groups, which is also reflected in the earnings data used to weight different staff categories to create the labour index. |
The new data source has been incorporated back to FYE 2011, the first complete financial year of data available. |
| Change in data source for General Practitioner (GP) FTE staff numbers in England | Following a consultation in 2015, NHS Digital have replaced the previous GP labour statistics for England produced from the workforce census with more detailed experimental statistics on the General and Personal Medical Services workforce. This data source is now used in the calculation of GP labour inputs. | This change has been incorporated only in the latest year of the series and does not result in revisions. |
| Changes to the methodology for HCHS labour inputs in England | Following the change of data source and the implementation of the new cubic splining system, the processing of labour inputs for England now takes place on a financial year basis, enabling production of an England financial year productivity measure.
As the labour inputs are now calculated wholly on a financial year basis, the labour index is splined into calendar years at the end of the process to produce the UK productivity statistics. |
Implementation of the new cubic splining methodology and data source changes have a small effect across the time series. |
| Changes to the methodology for GP labour inputs in England, and all labour inputs in Wales and Northern Ireland | With the implementation of the new cubic splining system, the use of workforce census data taken during September for GP inputs in England, and all labour inputs in Wales and Northern Ireland1, were re-evaluated. FTE numbers taken at September
are now used as an estimate for average financial year FTE numbers as opposed to average calendar year FTE numbers. Comparison of the HCHS data for the September census and the monthly workforce statistics shows that the estimation bias from using
September data to represent the average FTE numbers over a financial year is smaller than that from using September data to estimate the average over a calendar year. As the labour inputs are now calculated wholly on a financial year basis, the labour index is splined into calendar years at the end of the process to produce the UK productivity statistics. |
Implementation of the new cubic splining methodology has a small effect across the time series. |
| European Economic Area (EEA) medical costs | EEA medical costs, which cover expenditure by the UK government on treating UK nationals requiring treatment whilst in countries opted into the EEA medical costs scheme, have been deducted from the inputs throughout the series. This is because the activity associated with this spending is not included in output and is not eligible to be considered part of UK output under the European System of Accounts 2010 national accounts guidelines. | As EEA medical cost expenditure has fallen in recent years, the removal of this area of spending results in a slight upward revision of inputs, however, due to the small size of this element, the changes to overall inputs resulting from this change are small. |
| Private income | The treatment of private income has been changed so that it is no longer deducted from the non-NHS provider element of inputs. This improves the alignment of the non-NHS component of inputs with the non-NHS component in output. | This change does not change the overall expenditure covered in the inputs, but results in a small portion of inputs being redistributed to the non-NHS component and deflated using the deflators used for non-NHS provision. |
| Agency staff | Agency staff spending has been separately measured in the Wales goods and services inputs for the first time, and is deflated using the Pay Cost Index. | The methods change results in this component being deflated using a more appropriate deflator, but does not change the total expenditure on goods and services included in the inputs. |
| Pay deflator | Following the changes to the data sources used for labour inputs in England, we have reviewed and incorporated the new data sources in the calculation of the “Pay Cost Index” (PCI), which is used to calculate staff inputs from spending data where direct measures of staff numbers are not available. As part of the improvements, the data used to weight together changes in pay for different staff categories has changed from staff headcount numbers to full-time equivalent numbers. | The revised weighting has been included in all years of the PCI series from FYE 2004 onwards. The revision to the PCI affects a number of input series, including the labour element of non-NHS provided services and the Department of Health’s administration
costs, as well as agency staff costs. The new PCI is also used in the calculation of non-NHS output, which is produced on an "output-equals-inputs" basis. |
Notes:
- Data for Scotland record FTE numbers over a financial year, and were already processed on a financial year basis for previous publications.
Figure 6 shows the combined effect of the changes in data and methodology on the input growth and levels in this year’s publication relative to the previous publication. The revisions cause some differences in the annual growth rates across the years, but have only a minor effect on the overall trend, leaving the level of inputs in 2014 at a level 0.6% higher in this publication than in the previous publication.
Figure 6: Growth rate and index for public service healthcare inputs for current and previous publication, UK, 1995 to 2015

Source: Office for National Statistics
Download this image Figure 6: Growth rate and index for public service healthcare inputs for current and previous publication, UK, 1995 to 2015
.PNG (23.4 kB) .xls (27.6 kB)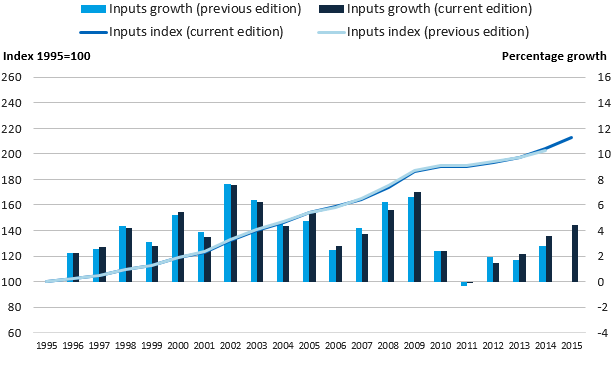
Output revisions
Revisions to the outputs resulted from improvements to the sources and methods used and a revision to the output growth calculation between financial year ending (FYE) 2013 and FYE 2014.
Revisions to output growth between FYE 2013 and FYE 2014
As with much of the input data, output data are received and processed on a financial year basis before being converted to a calendar year basis using cubic splining.
Improvements to processing, which primarily affected output growth for non-elective inpatients in England between FYE 2013 and FYE 2014, resulted in a downward revision to output growth for that year. In addition, revised data received from NHS Wales affected non-elective activity growth between FYE 2013 and FYE 2014, resulting in a higher growth rate for output for Wales between these years.
The net result of these two revisions is a growth rate for UK healthcare output between FYE 2013 and FYE 2014 that is approximately 0.6% lower in this publication relative to previous publications, and a lower level of healthcare output for years following the revision.
Methodological developments
Table 2 details the methodological improvements to output and their various effects.
Table 2: Methodological improvements to output
| Methods change | Detail of change | Effect of change |
| Conversion of financial year data to calendar year ("cubic splining") | As with inputs, the method used for converting financial year data into calendar years has been updated to the latest national accounts standards. More details can be found in "Inputs revisions". | As a result of incorporating this change, some of the annual growth rates have changed as the volume of output and input calculated from financial data has been apportioned between calendar years in a slightly different manner. |
| Incorporation of follow-up outpatient consultations in Wales output | Follow-up outpatient consultations have been added to the Wales output. These are already included in the output for the other three nations. | This change is incorporated in the data covering the period between FYE 2013 and FYE 2016 and results in a small fall in the growth rate of output. |
| Non-NHS output | The calculation of non-NHS output has been updated to incorporate the revised PCI deflator. More information on this can be found in "Input revisions". | This change has been implemented over the whole period for which the PCI deflator has been revised, for FYE 2004 onwards. |
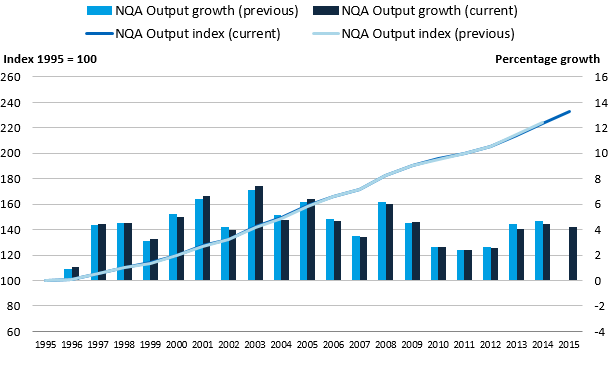
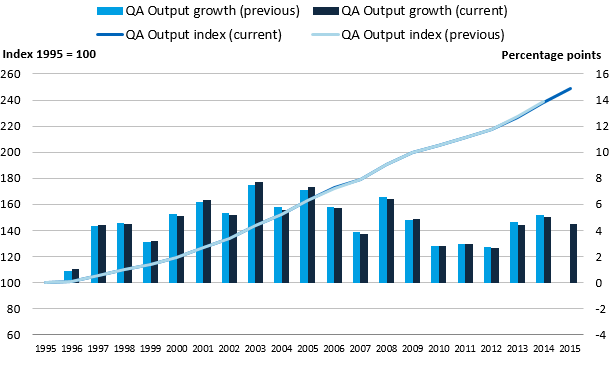
Figure 7a shows the effect of the revisions on non-quality adjusted output while Figure 7b shows the effect of the revisions on quality-adjusted output. As a result of the revisions, quantity output in 2014 is 0.6% lower in this year’s publication relative to the previous publication and quality-adjusted output is 0.3% lower.
The difference between the revision in quality-adjusted and non-quality adjusted output is not due to a change in the data used to produce the quality adjustment itself. Instead, because the effect of the quality adjustment depends on the output data to which it is applied, changes in output data can result in changes in the scale of the aggregate quality adjustment, while the introduction of the new cubic splining methodology also has an effect on the differences.
Figure 7a: Growth rate and index for public service healthcare quantity output for current and previous publication, UK, 1995 to 2015
Source: Office for National Statistics
Download this image Figure 7a: Growth rate and index for public service healthcare quantity output for current and previous publication, UK, 1995 to 2015
.PNG (23.8 kB) .xls (28.2 kB)
Figure 7b: Growth rate and index for public service healthcare quality-adjusted output for current and previous publication, UK, 1995 to 2015
Source: Office for National Statistics
Download this image Figure 7b: Growth rate and index for public service healthcare quality-adjusted output for current and previous publication, UK, 1995 to 2015
.png (23.8 kB) .xls (28.2 kB)
Overall effect of revisions on public service healthcare productivity
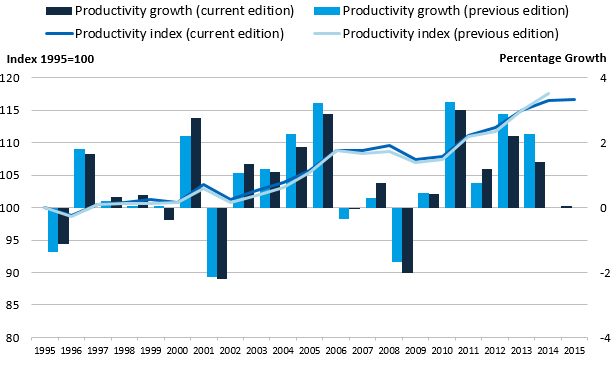
Figure 8a and Figure 8b show the effect of the revisions on the growth rate of productivity. The largest revisions are to the 2013 and 2014 growth rate, partly due to the downward revision in output resulting from the changes to non-elective activity in England in FYE 2014, and to an upward revision to inputs in 2014.
Overall, the revisions have resulted in a reduction in the average annual growth rate for healthcare productivity between 1995 and 2014, from 0.9% to 0.8%, leaving the level of productivity in 2014 at a level 0.9% lower in this publication relative to the previous publication.
Figure 8a: Revisions to public service healthcare productivity growth rates, UK, 1996 to 2014
Source: Office for National Statistics
Download this chart Figure 8a: Revisions to public service healthcare productivity growth rates, UK, 1996 to 2014
Image .csv .xls
Figure 8b: Growth rate and index for public service healthcare productivity for current and previous publication, UK, 1995 to 2015
Source: Office for National Statistics
Download this image Figure 8b: Growth rate and index for public service healthcare productivity for current and previous publication, UK, 1995 to 2015
.PNG (24.4 kB) .xls (27.6 kB)
Data for revisions to public service healthcare inputs, quantity and quality adjusted output, and productivity growth rates compared with previously published statistics, are available in the dataset accompanying this release.
Nôl i'r tabl cynnwys9. Healthcare productivity for England on a financial year basis
Previous public service healthcare productivity statistics have been produced for the UK only and on a calendar year basis, an equivalent geography and periodicity to UK National Accounts products, such as the Blue Book, which share much of the data. In this section, we include the inputs, output and productivity series for England on a financial year basis.
These figures have been produced to provide a further measure to healthcare policy analysts, which is on a more consistent basis with other statistics that cover the English NHS, where financial data are typically reported on a financial year basis (that is, 1 April to 31 March)1.
The England financial year productivity measure differs from the UK calendar year productivity measure in the following:
- quantity output is restricted to output from England only
- the labour and goods and services components of inputs are restricted to England only
- many of the data sources used by Office for National Statistics (ONS) are created on a financial year basis, and a process called “cubic splining”2 is used to produce the calendar year measures; however, this process is not carried out in the production of this England, financial year measure
However, to maintain the methodological consistency with the UK productivity estimates, a number of data sources remain unchanged:
- it is not possible to disaggregate the national accounts capital consumption data to a sub-UK level, so UK data continue to be used for this component
- the three input components – labour, goods and services, and capital consumption – have been weighted together to form the total inputs index using UK-level data from the National Accounts; this means that the proportion of total inputs made up of each of the three components is the same in both the UK and England series
- in the UK healthcare productivity series, the quality adjustment to output is produced using England-only data, but is applied to UK output; while in the England financial year productivity series, the same quality adjustment is used, but is applied to England output only
Due to these changes, the England financial year healthcare productivity measure provides a better estimate for measuring the productivity of the English health system, while the UK calendar year productivity measure remains more suitable for measurement at a UK level3 and continues to be used as a component of total public service productivity.
It should, however, be noted that differences between the England and UK productivity measure cannot be used to estimate healthcare productivity for the devolved administrations. This is because, while data from the devolved administrations are used to produce the UK productivity series, there are differences in the coverage of the data, and some elements of devolved administration output and inputs are imputed based on data from England or the group of UK nations for which data are available.
Figure 9 shows the inputs, output and productivity series for England on a financial year basis. As a result of England having the largest expenditure weight in the UK measure, the trend for public service healthcare productivity on an England, financial year basis is similar to that for the whole UK on a calendar year basis, with productivity growth increasing after inputs growth falls in financial year ending (FYE) 2011 and slowing productivity growth in FYE 2016.
Figure 9: Public service healthcare output, inputs and productivity indices and growth rates for England, financial year ending 1996 to financial year ending 2016
Source: Office for National Statistics
Download this image Figure 9: Public service healthcare output, inputs and productivity indices and growth rates for England, financial year ending 1996 to financial year ending 2016
.png (37.0 kB) .xls (21.5 kB)
More series on an England, financial year basis are available from the dataset accompanying this release.
Notes for: Healthcare productivity on an England, financial year basis
- While the Centre for Health Economics at the University of York already produces a measure of healthcare productivity for England, there are a number of differences in the data sources and methods used, which are detailed in section 10.
- Cubic splining involves the imputation of quarterly data based on trends in data over multiple financial years and constructs a calendar year figure based on these imputed quarterly figures.
- In the calculation of the UK healthcare productivity statistics, the labour, goods and services, and output series for the constituent nations of the UK are weighted together using healthcare expenditure data from HM Treasury’s Country and regional analysis. Goods and services inputs for Northern Ireland are currently imputed based on the rate of goods and services input growth from the rest of the UK.
10. Comparisons with other measures of output and productivity
Other ONS output and productivity measures
It is important to recognise that the productivity statistics published in this article are based on a concept of output as measured by government consumption expenditure rather than government or state production. This follows from the submission of the estimates of the volume of government output that are used in this article (prior to any quality adjustment) to the gross domestic product (expenditure) (GDP (E)) side of the UK National Accounts. This means that we are using a measure of government-purchased output, regardless of what type of business unit produced the output. As with other aspects of the methodology employed in producing these statistics, this approach is consistent with that recommended by the Atkinson Review (PDF, 1.08MB).
In the case of healthcare, although most expenditure is used to fund state providers of health services and its administration, there is a growing component of expenditure on private and third sector-provided health services. This is included within government output in our articles, even though it is provided by business units that are classified as private businesses or non-profit institutions serving households (NPISH) in the UK National Accounts, and this is why the term “public service” is used instead of “public sector”.
Traditional measures of private sector or whole-economy productivity, including those published by Office for National Statistics (ONS), use a supply or production framework. These measures of productivity use Standard Industrial Classification (SIC 2007) categories of production as the measure of output and are on a gross value added (GVA) basis. Input measures count the labour (jobs or hours) used in the production of these goods and services to estimate labour productivity series such as those produced by ONS. We also produce Experimental Statistics on whole-economy multi-factor productivity, which include labour and capital services as inputs.
The interpretation of the expenditure-based productivity estimates presented in this article should therefore be taken as a measure of the productivity of government-funded healthcare services for individuals in the UK (from whatever type of business unit), and not necessarily government-provided services. Caution should be used when considering the differences between productivity measures published using the expenditure approach (which will include services purchased by government from the independent sector) and those using the traditional production approach (which will only include government-produced services).
More information on the difference between these two approaches is available in a paper we published in June 2015: Comparing public service productivity estimates.
Other healthcare output and productivity measures
The English financial year productivity figure is produced on a similar basis to an alternative healthcare productivity measure produced by the Centre for Health Economics at the University of York in the series Productivity of the English NHS (PDF, 3.24MB). While both series apply the Atkinson framework, and part of the quality adjustment is produced by the University of York and used in both publications, the two series provide slightly different estimates of productivity growth.
For example, the productivity growth rate in the ONS series of 0.9% in financial year ending (FYE) 2015 differs from the rate of 0.5% in the University of York series, while the average productivity growth rate over the period between FYE 2005 and FYE 2015 was 1.4% in the ONS series and 1.3% in the University of York series.
These differences arise from a number of differences in the source data used in the two publications including:
- different sources and methods used in the calculation of output, including Hospital and Community Health Services (HCHS) output and the estimation of General Practitioner (GP) activity
- different data sources used in the calculation of inputs, particularly goods and services inputs and capital inputs
- while the largest element of the quality adjustment is common between the two productivity measures, there are minor differences in some parts of the quality adjustment and their application to output data
No single productivity measure is definitive and productivity measures cannot alone provide a perfectly comprehensive view of service efficiency, as they do not indicate whether the inputs have been purchased at the lowest possible cost, or whether the desired outcomes are achieved through the output provided.
Nôl i'r tabl cynnwys11. Acknowledgements
The authors would like to thank Adriana Castelli and Idaira Rodriguez Santana from the University of York for the provision of quality adjustment data and comments, and Sharon Allen, John Bates, James Gordon, Bernard Horan, Caroline Lee, John Morris, Paudric Osborne, Joel Solway and Samantha Swann for the provision of output and input data and comments.
Nôl i'r tabl cynnwys12. Quality and Methodology
The Public service productivity estimates: healthcare Quality and Methodology Information report contains important information on:
- the strengths and limitations of the data and how it compares with related data
- uses and users of the data
- how the output was created
- the quality of the output, including the accuracy of the data
More detailed information on methods is available in the healthcare sources and methods paper (PDF, 328.65KB).
Nôl i'r tabl cynnwys