
Cynnwys
- Main points
- Public service healthcare productivity overview
- Inputs
- Output quantity
- Output quality
- Revisions
- Healthcare productivity for the UK on a calendar year basis
- Comparisons with other measures of output and productivity
- Public service healthcare productivity data
- Glossary
- Data sources and quality
- Related links
1. Main points
In the financial year ending 2019 (FYE 2019), public service healthcare productivity decreased by 0.5%, its first fall since FYE 2010
Growth in the inputs used in the provision of healthcare increased to 2.7% in FYE 2019, up from 1.7% in FYE 2018, but still less than the average growth for the series of 3.7%
Growth in the non-quality adjusted output provided slowed to 1.8% in FYE 2019; this was only slightly slower than growth in FYE 2018, but represented the slowest output growth since FYE 1997
The quality adjustment added 0.4 percentage points to output growth in FYE 2019, indicating an increase in service quality; this was a similar quality adjustment effect to FYE 2018 and slightly below the annual average since FYE 2001
Non-quality adjusted productivity fell by 0.9%, although even after this fall, non-quality adjusted productivity remained 16.8% higher in FYE 2019 than in FYE 1996
As the data used in this article run only to March 2019, these figures do not cover changes in productivity caused by the coronavirus (COVID-19) pandemic
2. Public service healthcare productivity overview
Public service healthcare productivity is estimated by comparing growth in the total quantity of healthcare output provided (adjusted for quality where possible) with growth in the total quantity of inputs used. If output growth exceeds input growth, productivity increases, meaning that more output is being produced for each unit of input. Conversely, if input growth exceeds output growth then productivity will fall.
This article analyses the inputs, output and productivity of public service healthcare for England on a financial year basis. Updated figures for public service healthcare productivity for the UK on a calendar year basis, which were previously published in Public service productivity: healthcare, UK, are now available in Section 7 and the reference tables. It should be noted that figures for public service healthcare productivity are not comparable between the England and UK geographies, as explained in Section 7.
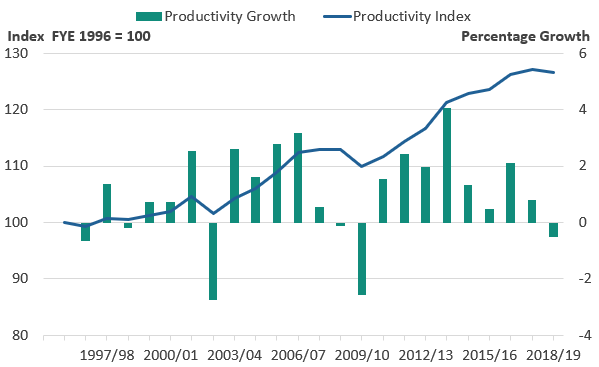
Figure 1 shows that public service healthcare productivity fell by 0.5% in financial year ending 2019 (FYE 2019), the first fall observed since FYE 2010.
It should be noted that, as the data required are not yet available, figures in this release extend only as far as the end of FYE 2019 (March 2019), and so do not cover the period affected by the coronavirus (COVID-19) pandemic. Therefore COVID-19 has not been the cause of the productivity fall in the latest year or other trends observed in this series.
Figure 1: Public service healthcare productivity fell in financial year ending (FYE) 2019 after eight consecutive years of growth
Public service healthcare productivity index and growth rate, England, financial year ending (FYE) 1996 to FYE 2019
Source: Office for National Statistics
Notes:
- Output is quality adjusted.
- Annual growth rates are shown as bars (measured against the right axis) while the cumulative changes in the series since FYE 1996 are shown by the line (measured against the left axis and indexed to a level of 100 in FYE 1996).
Download this image Figure 1: Public service healthcare productivity fell in financial year ending (FYE) 2019 after eight consecutive years of growth
.png (27.7 kB) .xlsx (20.0 kB)
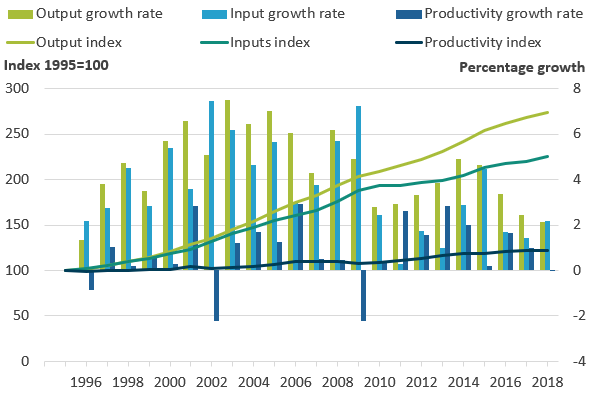
Figure 2 shows that the fall in healthcare productivity in FYE 2019 was due to inputs growth increasing to 2.7%, up from 1.7% in FYE 2018, while output growth was 2.2% in FYE 2019, slightly slower than the 2.5% observed in FYE 2018.
Figure 2: Productivity fell in financial year ending (FYE) 2019 because of faster inputs growth and slightly slower output growth than observed in FYE 2018
Public service healthcare output, inputs and productivity indices and growth rates, England, financial year ending (FYE) 1996 to FYE 2019

Source: Office for National Statistics
Notes:
- Output is quality adjusted.
- Annual growth rates are shown as bars (measured against the right axis) while the cumulative changes in the series since financial year ending (FYE) 1996 are shown by the lines (measured against the left axis and indexed to a level of 100 in FYE 1996).
- Growth rates may not match because of rounding.
Download this image Figure 2: Productivity fell in financial year ending (FYE) 2019 because of faster inputs growth and slightly slower output growth than observed in FYE 2018
.png (39.8 kB) .xlsx (20.7 kB)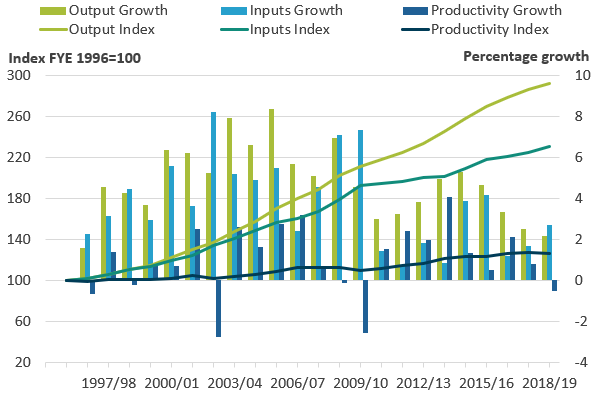
Despite the fall in productivity observed in FYE 2019, overall productivity growth has been stronger during the 2010s than during the 2000s. Annual productivity growth averaged 0.8% between FYE 2000 and FYE 2010 and 1.6% since FYE 2010.
The faster productivity growth observed in the 2010s is due to average inputs growth having slowed more than average output growth. Average annual inputs growth slowed from 5.4% between FYE 2000 and FYE 2010 to 2.0% since FYE 2010, while output growth slowed from 6.3% to 3.7% over the same periods.
It should be noted that these productivity estimates provide a measure of the amount of output that is produced for each unit of input, but they do not measure value for money or the wider performance of public healthcare services. They do not indicate, for example, whether the inputs have been purchased at the lowest possible cost, or whether the desired outcomes are achieved through the output provided.
Nôl i'r tabl cynnwys3. Inputs
Inputs in the public service healthcare productivity measure are broken down into three components:
labour, or staff inputs
goods and services inputs, which include the intermediate consumption of supplies and services used by healthcare providers, such as gloves and syringes; this component also includes GP-prescribed drugs, services provided by non-NHS organisations and agency staff costs
capital consumption, which covers the cost of depreciation of capital goods (items that are anticipated to be in use for a year or more, such as buildings and vehicles) over time
Labour inputs are largely measured using changes in the number of full-time equivalent employees of the health service, weighted by their average earnings. Inputs for goods and services are estimated by adjusting expenditure for each sub-component using appropriate measures of inflation, known as deflators. This removes the effects of price changes from current price expenditure and so produces a quantity input measure. Capital consumption is measured using the perpetual inventory method, as used in the UK National Accounts.
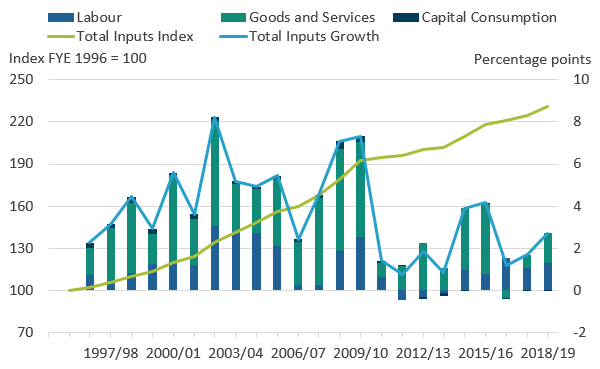
Figure 3 shows total inputs growth and how growth in each component contributes to the growth in overall inputs. In financial year ending (FYE) 2019, inputs grew by 2.7%, up from 1.7% the previous year, but below the 3.7% average growth for the whole time series.
Figure 3: Inputs growth of 2.7% in financial year ending (FYE) 2019 was higher than the previous two years, but below the average growth of the whole time series data of 3.7%
Public service healthcare inputs quantity growth by component, England, financial year ending (FYE) 1996 to FYE 2019
Source: Office for National Statistics
Notes:
- Figure 3 shows the inputs growth by component after weighting by their share of total expenditure.
- Contributions to growth may not sum to overall growth because of rounding.
Download this image Figure 3: Inputs growth of 2.7% in financial year ending (FYE) 2019 was higher than the previous two years, but below the average growth of the whole time series data of 3.7%
.png (40.7 kB) .xlsx (20.5 kB)
Total healthcare inputs increased at an average annual rate of 3.7% between FYE 1996 and FYE 2019, resulting in healthcare inputs being 2.3 times greater in FYE 2019 than in FYE 1996. Over this period, goods and services inputs contributed the largest share of input growth. This is in part because of two elements that are also included in output and so have a minimal effect on productivity: non-NHS provision, which is included on this basis because of a lack of activity data, and GP-prescribed drugs, which are simultaneously considered both an input and an output.
Total inputs growth has varied over time and slowed markedly after FYE 2010, with an average growth of 5.4% over the 2000s and an average growth of 2.0% during the 2010s, with lower growth in all three input components. However, the years FYE 2015 and FYE 2016 stand out as having higher inputs growth than other years during the 2010s. This was because of a combination of factors, including growth in labour inputs, and stronger growth in goods and services inputs from non-NHS provided services, NHS providers’ intermediate consumption and agency staff.
Figure 4 shows the unweighted growth in the three components: labour, goods and services inputs, and capital consumption.
Figure 4: Growth in all three components of healthcare inputs has been slower on average during the 2010s than in the 2000s
Public service healthcare inputs quantity growth by component, England, financial year ending (FYE) 1997 to FYE 2019
Source: Office for National Statistics
Notes:
- Figure 4 shows the inputs growth by component before it is weighted by expenditure shares.
Download this chart Figure 4: Growth in all three components of healthcare inputs has been slower on average during the 2010s than in the 2000s
Image .csv .xlsInputs growth in FYE 2019 was attributable to both labour, and goods and services inputs.
In FYE 2019, goods and services inputs grew by 3.0% which, while faster than the 1.3% growth observed in FYE 2018, was still well below the average rate of 6.0% observed over the whole period FYE 1996 to FYE 2019.
Factors which contributed to this faster growth in inputs in FYE 2019 include:
an increase in agency staff inputs caused by negative inflation in agency staff costs given by the new agency staff deflator described in our methodology article
increased growth in non-NHS inputs relative to FYE 2018
relatively rapid growth in goods and services inputs in general practice
Goods and services inputs growth is slower than expenditure growth where there is positive inflation in input costs, as this results in each pound spent on inputs purchasing fewer inputs in real terms. There was a general increase in input cost inflation measures in FYE 2019, such as the NHS Cost Inflation Index, which tempered goods and services inputs growth.
In FYE 2019, labour inputs grew by 2.6%, faster than the average growth rate over the whole period FYE 1996 to FYE 2019 for the third year running. This rate was similar to the trend of recent years, as labour inputs growth rebounded following a slight fall in the level of labour inputs between FYE 2011 and FYE 2014.
Growth in labour inputs in FYE 2019 was due to increases in full-time equivalent staff numbers across a range of staff groups. Consistent with recent years, there were large contributions to labour input growth from consultants, and scientific, technical and therapeutic staff, where full-time equivalent staff numbers increased by 3.2% in FYE 2019.
Not all workers in the NHS are included in the labour input measure. Agency staff are included in the goods and services element of inputs as, unlike NHS bank staff, agency workers are not employees of the health service. In contrast, NHS bank staff, who fulfil a similar role to agency staff, working variable hours in response to demand, have been included in the labour measure from FYE 2016 onwards.
The rise in NHS bank staff spending can be linked to a fall in agency staff spending, which followed the introduction of a cost-per-hour cap on agency staff, introduced in the English NHS in November 2015 and extended to all staff categories in April 2016. NHS England estimates agency staff costs are on average 20% higher than NHS bank staff costs and so has promoted the use of NHS bank staff in place of agency staff, including through an NHS Professionals campaign, launched in 2016, to encourage nurses to join staff banks.
Reflecting these policy ambitions, between FYE 2016 and FYE 2018, there was a substantial decline in agency staff expenditure, but this rate of decline almost levelled off in FYE 2019, leaving agency staff expenditure 35.2% lower in FYE 2019 than FYE 2016. There was an offsetting effect on inputs from NHS bank staff expenditure, which increased strongly over this period, nearly doubling.
Because of a lack of data on the pay cost growth specific to NHS bank staff, the volume measures for these inputs are produced using expenditure deflated by the pay cost inflation of substantive NHS staff. The pay cost inflation of substantive NHS staff is also used to deflate agency staff expenditure, except for the latest year (FYE 2019), where new data on NHS agency staff has been used to produce a new, more specific, deflator. More information on this new deflator can be found in our recent methods change article. As we cannot confirm how different the pay growth of agency and NHS bank staff is from that of substantive NHS staff, and the new deflator for agency staff spending for FYE 2019 is an estimate, the volume inputs measures for these staff groups are subject to increased uncertainty.
Nôl i'r tabl cynnwys4. Output quantity
The quantity of healthcare output is measured using the number of individual healthcare activities performed, weighted by the cost of each activity. As a result of this weighting process, growth in treatments that are common and expensive has a greater effect on the output index than a similar rate of growth in treatments that are uncommon and low-cost.
Healthcare output is separately estimated for each of the following components:
- Hospital and Community Health Services (HCHS) – includes hospital services, community care, mental health and ambulance services
- primary care – includes general practice and publicly-funded dental and ophthalmic care
- GP-prescribed drugs
- non-NHS provision – includes healthcare funded by the government but provided by the private or third sector
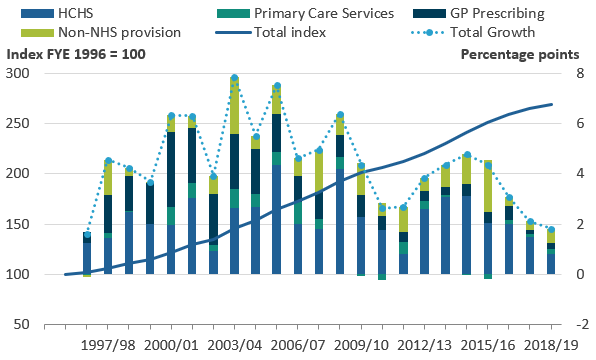
Figure 5 shows the effect of the four components of quantity output on total quantity output, excluding the effect of quality adjustment, which is introduced in Section 5. As total quantity output is produced by weighting together the components by their share of total expenditure, the effect on output of each component depends both on its growth rate and share of expenditure.
Figure 5 shows that the slower output growth in financial year ending (FYE) 2019 relative to FYE 2018 is driven by slower growth in HCHS, the largest of the four output components, accounting for over two-thirds of output.
Figure 5: In financial year ending (FYE) 2018, total output quantity growth was at its slowest rate since FYE 1997
Contributions to public service healthcare quantity output growth by component, England, financial year ending (FYE) 1996 to FYE 2019
Source: Office for National Statistics
Notes:
- HCHS – Hospital and Community Health Services.
- Primary Care Services was previously Family Health Services.
- The sum of components of quantity output may not equal total output because of rounding.
- The contribution to growth for each component depends on both its growth rate and its weight in total output.
- Excludes quality adjustment.
Download this image Figure 5: In financial year ending (FYE) 2018, total output quantity growth was at its slowest rate since FYE 1997
.png (38.6 kB) .xlsx (20.3 kB)
Figure 6 shows HCHS output grew only 1.2% in FYE 2019, the slowest growth recorded in our time series. The slowdown in growth relative to FYE 2018 was not attributable to any particular service but reflects subdued or negative growth in a range of NHS hospital and community services. For instance, in FYE 2019, high cost drugs and chemotherapy services grew more slowly than in FYE 2018, while falls in output were observed for NHS-provided mental health and radiology services.
Falls in output of elements of the NHS-provided HCHS component do not necessarily mean overall provision for these services has fallen. It should be noted that while the growth rate for HCHS reduced from 2.2% to 1.2% last year, the growth in publicly-funded non-NHS provided healthcare output increased from 2.5% to 4.0%. This may reflect a transfer of provision from the NHS provided sector to the non-NHS provided sector, for some of the services for which falls in the HCHS output are observed. However, the available data unfortunately do not enable us to confirm which services within non-NHS output are increasing and therefore we cannot confirm if non-NHS provided output is offsetting NHS provided output.
The HCHS output measure in this article uses the NHS Reference Costs and National Cost Collection. It should also be noted that different data sources are available for measuring HCHS output and these can result in differences in the growth rates reported. Alternative data from the NHS Hospital Episode Statistics and Secondary Uses Service show faster growth in the number of HCHS activities undertaken, although these data sources have differences in coverage, such as overlaps with some non-NHS provided services. The ONS regularly reviews the suitability of the data sources used and intends to undertake further investigation into these data sources in future.
Figure 6: In financial year ending (FYE) 2019, HCHS grew at its slowest rate recorded in the time series data, but other output components grew faster in FYE 2019 than FYE 2018
Public service healthcare quantity output growth by component, England, financial year ending (FYE) 1997 to FYE 2019
Source: Office for National Statistics
Notes:
- HCHS – Hospital and Community Health Services.
- Primary Care Services was previously Family Health Services.
Download this chart Figure 6: In financial year ending (FYE) 2019, HCHS grew at its slowest rate recorded in the time series data, but other output components grew faster in FYE 2019 than FYE 2018
Image .csv .xlsPublicly funded healthcare output from non-NHS providers grew by 4.0% in FYE 2019, the fastest growth in this component since FYE 2016 when growth was 17.6%. Non-NHS provision has seen faster growth in earlier years in the series, although it should be noted that earlier in the series non-NHS provision accounted for a relatively small share of expenditure and so the very high growth rates seen for non-NHS provision in FYE 1998 and FYE 2004 do not necessarily translate into very large absolute increases in healthcare output.
The smallest two components of output, GP-prescribed drugs and primary care services, both experienced more growth in FYE 2019 than FYE 2018. GP-prescribed drugs grew at 2.6% in FYE 2019, slightly faster than in the previous year, although this was still the second slowest growth rate of the series and well below the average growth rate for this element since FYE 1996 of 6.9%.
The faster growth of primary care services in FYE 2019 than FYE 2018 was due mainly to its largest element, general practice. Growth in primary care services in FYE 2019 was its fastest since FYE 2013, but remained lower than the average growth over the decade of the 2000s. The methodology used in measuring primary care services output has been extensively improved in this edition of the release and more information on these developments can be found in Section 6: Revisions.
Growth in the quantity of healthcare provided should be seen in the context of healthcare demand and its drivers. One of these drivers is an ageing population: while the total population of England grew at an annual average rate of 0.6% over the period 1995 to 2018, the population aged 75 years and over grew at 1.3%. However, research by bodies such as the Organisation for Economic Co-operation and Development suggests that demographic effects, such as a larger population and an increasing number of people aged 75 years and over, have a relatively small impact on healthcare expenditure and output growth. Factors such as medical advances, healthcare institutions and public expectations are viewed as more significant factors in explaining increases in healthcare expenditure and output over time (see Public spending on health and long-term care: a new set of projections for more information).
Nôl i'r tabl cynnwys5. Output quality
Healthcare quantity output is adjusted for changes in quality of the service from financial year ending 2002 (FYE 2002) onwards. The quality adjustment incorporates a range of factors covering short-term post-operative survival rates, the estimated health gain from hospital procedures, waiting times, patient satisfaction and primary care outcomes. The quality adjustment is applied to the output of Hospital and Community Health Services and primary care, which together account for 77% of output.
More information about quality adjustment in public service productivity is available in this guide, while information about the quality adjustment used for healthcare output can be found in Quality adjustment of public service health output: current method.
A positive quality adjustment indicates that the quality of healthcare services provided, as defined by the selection of indicators used in the quality adjustment, has improved. It should be noted that while the quality adjustment aims to cover a range of relevant aspects of healthcare quality, it cannot be taken as a comprehensive indicator of the quality or outcomes of all NHS services.
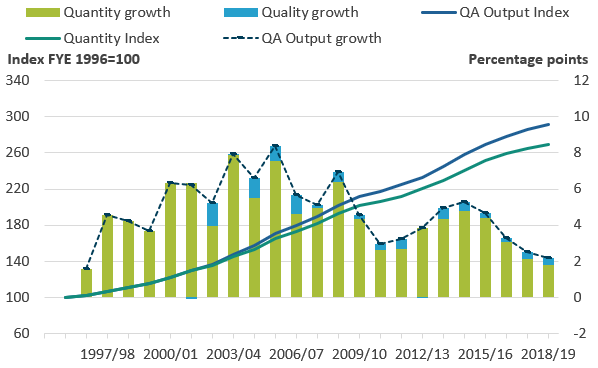
Figure 7: Adjusting for quality added 0.4 percentage points to output growth in financial year ending (FYE) 2019
Public service healthcare quantity and quality adjusted output indices and growth rates, England, financial year ending (FYE) 1996 to FYE 2019
Source: Office for National Statistics
Notes:
- QA - quality adjusted.
- Quality growth may not match the difference in QA and NQA output growth because of rounding.
Download this image Figure 7: Adjusting for quality added 0.4 percentage points to output growth in financial year ending (FYE) 2019
.png (37.1 kB) .xlsx (20.2 kB)
In financial year ending 2019 (FYE 2019), the quality adjustment added 0.4 percentage points to the output growth rate, a similar addition to growth as in FYE 2018, but slightly less than the average addition to growth of 0.5 percentage points across the whole series. The increase in quality in FYE 2019 was driven largely by improved hospital and community health services outcomes in relation to survival rates. These improvements in quality outcomes are partially offset by a slight fall in patient-reported experience.
After adjusting for quality, output growth in FYE 2019 was 2.2%, which was slower than the 2.5% increase in quality-adjusted output in FYE 2018.
Figure 8: The quality adjustment accounted for 40% of the overall increase in healthcare productivity between financial year ending (FYE) 2001 and FYE 2019
Public service healthcare quantity and quality-adjusted productivity indices and growth rates, England, financial year ending (FYE) 1996 to FYE 2019

Source: Office for National Statistics
Download this image Figure 8: The quality adjustment accounted for 40% of the overall increase in healthcare productivity between financial year ending (FYE) 2001 and FYE 2019
.png (34.4 kB) .xlsx (20.0 kB)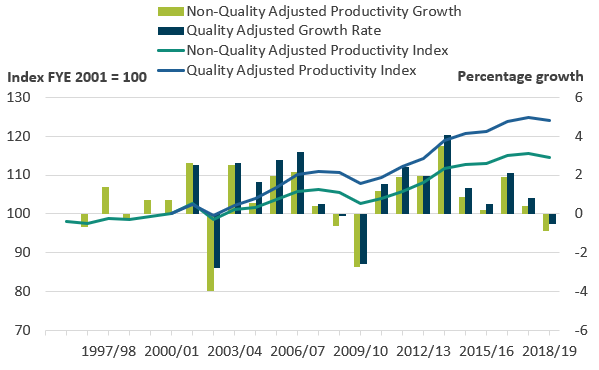
Figure 8 shows the growth of healthcare productivity with and without the quality adjustment applied, with both series indexed to FYE 2001, the year before the quality adjustment was introduced.
Over the period FYE 2001 to FYE 2019, quality-adjusted productivity grew at an average rate of 1.2% and non-quality adjusted productivity grew at an average rate of 0.8%. Over the whole time series from FYE 1996 to FYE 2019, non-quality adjusted productivity grew at an average rate of 0.7%. However, growth in non-quality adjusted productivity amounted to only a small increase in this measure between FYE 1996 and FYE 2010, with most of the increase happening since FYE 2010.
The gap between the quality adjusted and non-quality adjusted productivity indices shown in Figure 8 has widened steadily over the period. This has occurred because, while the effect of quality adjustment on annual output growth has been small, the quality adjustment has been positive in every year except for a small drop in FYE 2002 and a nil change in FYE 2013.
Nôl i'r tabl cynnwys6. Revisions
Figure 9 shows how the healthcare productivity series has been revised since the last edition.
Figure 9: Total productivity growth over the series has been revised up since the last release, primarily as a result of methodological improvements to primary care output
Revisions to public service healthcare productivity, England, financial year ending (FYE) 1996 to FYE 2018
Source: Office for National Statistics
Notes:
- Output is quality adjusted.
- Productivity when output is quality adjusted.
Download this image Figure 9: Total productivity growth over the series has been revised up since the last release, primarily as a result of methodological improvements to primary care output
.png (35.4 kB) .xlsx (20.0 kB)
Total productivity growth over the series to financial year ending 2018 (FYE 2018) has been revised up by 3.1%, when compared with figures published in last year's bulletin. Revisions to productivity growth tended to be upward in most years, with a maximum revision in any given year of 0.5%. These revisions are mostly a result of upward revisions to our measure of healthcare output.
Revisions to healthcare output
Methodological improvements to the measurement of primary care1 output have resulted in revisions across the whole series. The most substantial improvement is the introduction of a new measure of general practice output, based on a newly available source of GP activity data since financial year ending (FYE) 2018. We have also improved the modelled estimates for the period FYE 2008 to FYE 2018 where national GP activity data are unavailable, using a method developed by the University of York2 that incorporates patient survey data to reflect changes in consultation rates per person. The unit costs used to cost-weight activity to obtain output growth have also been updated throughout the series.
We have also made improvements to other elements of primary care output in particular, dental and ophthalmic services. For these components, we now calculate output growth using more detailed data, which distinguish between different NHS dental and ophthalmic activities. This means that changes in the number of higher cost activities, such as fitting crowns and bridges, accounts for a greater weight than equivalent changes in the number of lower cost activities such as regular examinations and x-rays. For dental services, five reimbursement bands of “courses of treatment” are used and for ophthalmic services activity is distinguished by the type of eye tests conducted and the number of optical vouchers issued.
For further information around these new methods please see: Methodological developments to public service productivity, healthcare: 2021 update.
Revisions to other output components were minor, with small revisions to non-NHS output, as a result of revisions to some of the data used in the NHS Cost Inflation Index, used to deflate expenditure.
Figure 9 shows that output growth over the whole series has tended to have been revised upward, leading to output in FYE 2018 relative to FYE 1996 being 1.2% higher than in the series presented last year. This is largely driven by higher output growth in the early part of the series. However, in more recent periods, output growth has been revised downwards. This is representative of the previous modelled estimates being unable to capture changes in GP consultations rates per person.
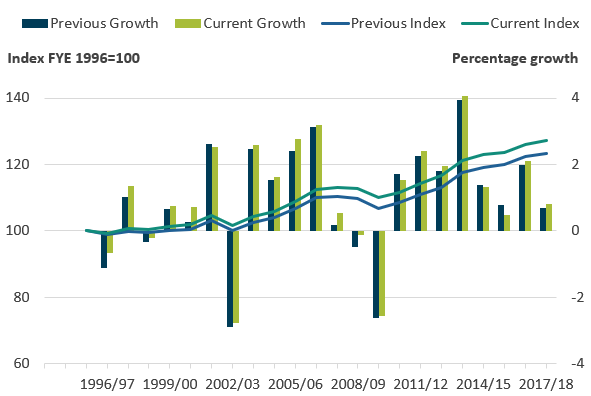
Figure 10: Primary care output growth has generally been revised up for years up to financial year ending (FYE) 2009 and generally revised down for the years since, leaving total growth similar to the last release
Growth rate and index for public service healthcare primary care quantity output for current and previous publication, England, financial year ending (FYE) 1996 to FYE 2018

Source: Office for National Statistics
Notes:
- Output is not quality adjusted.
- Primary Care Services was previously Family Health Services.
Download this image Figure 10: Primary care output growth has generally been revised up for years up to financial year ending (FYE) 2009 and generally revised down for the years since, leaving total growth similar to the last release
.png (33.6 kB) .xlsx (19.9 kB)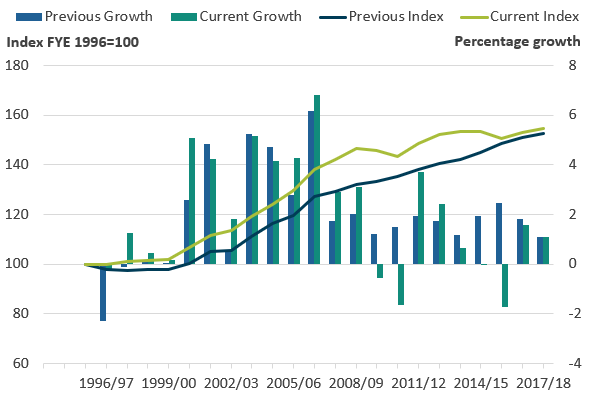
The review of the unit costs used to cost-weight activity has resulted in downward revisions to the overall weight of primary care services in relation to other service sectors, with the cost-weight assigned to primary care overall much closer to the total expenditure of these services combined. As a share of overall output, the cost-weight for primary care in England in FYE 2018 has fallen from 15.6% to 10.0%. This is primarily due to lower estimates of overall activity and changes to the composition of activity by consultation type, with higher levels of lower value activity. The share is further reduced by a methodological change that removes services relating to emergency walk-in centres, as these are separately classified within HCHS component and so have been removed from the primary care estimates.
The impact of these changes is to raise overall healthcare output growth over the course of the series. Output in FYE 2018 relative to FYE 1996 was 2.9% higher in this edition, compared with the previous edition. While the new primary care output measure grows only 1.2% more than the old FHS output measure over the series, overall output increases by more as a result of the cost-weight of primary care output being revised down. As a result, faster growing elements of output, particularly HCHS, have an increased weight in the new overall output measure, revising up the overall output growth rate. This reweighting has also led to minor changes in the quality adjustment
Figure 11: Primary care output now accounts for a smaller proportion of total output relative to faster-growing elements, resulting in more output growth over the series
Growth index for public service healthcare output for current and previous publication, England, financial year ending (FYE) 1996 to FYE 2018
Source: Office for National Statistics
Notes:
- Output is quality adjusted.
Download this chart Figure 11: Primary care output now accounts for a smaller proportion of total output relative to faster-growing elements, resulting in more output growth over the series
Image .csv .xlsIt should be noted that while the output data are predominantly shared with the UK National Accounts, the public service productivity estimates operate an open revisions policy. This means that the estimates in this release include new output data for FYE 2019 and methodological developments to primary care output, which as of February 2021, are not incorporated in the National Accounts. We intend to incorporate the new output data for FYE 2019 in the UK National Accounts, The Blue Book: 2021, while the methodological developments to primary care output will be considered for inclusion in the National Accounts when the availability to make changes allows.
Revisions to healthcare inputs
Revisions to inputs are far smaller than the revisions to output. The level of healthcare inputs in FYE 2018 relative to FYE 1996 has been revised downward by 0.2% in this release and the growth rate in any given year revised by no more than 0.2% up or down.
Revisions to inputs are largely a result of regular revisions to capital consumption data in the Annual National Accounts, more information on which can be found in the capital stocks release. Minor revisions to goods and services inputs between FYE 2016 and FYE 2018 are a result of revisions to the NHS Cost Inflation Index, used to deflate goods and services expenditure.
Notes for: Revisions
In previous publications of Public service productivity: healthcare, primary care output was referred to as family health service (FHS) output. This component has been renamed to modernise the terminology.
7. Healthcare productivity for the UK on a calendar year basis
In addition to the public service healthcare productivity statistics produced on an England and financial year basis, we also produce such statistics on a UK and calendar year basis, with the two measures serving different purposes. The England and financial year measures analysed in the earlier sections of this article are produced on this basis to provide healthcare policy analysts with statistics comparable with other financial data on the English NHS, which are typically reported by financial year (that is, 1 April to 31 March)1 . The alternative UK and calendar year basis matches the geography and periodicity to UK National Accounts products, such as the Blue Book, which share much of the data, and form a component of the series Public service productivity, total, UK. Public service productivity, total, UK, 2018 is expected to be published in April 2021.
The England, financial year, and UK, calendar year measures cannot be directly compared and conclusions about trends in productivity in the devolved administrations cannot be derived from differences between the two measures. This is due to differences in data collection and coverage, the statistical processes used to convert financial year data into calendar years and the need to substitute some UK data for England data in the England measure and replace some missing devolved administration data in the UK measure. In particular:
it is not possible to disaggregate the National Accounts capital consumption data to a sub-UK level, so UK data are used for this component in both UK and England measures
the three input components – labour, goods and services, and capital consumption have been weighted together to form the total inputs index using UK-level data from the National Accounts and, as a result, the proportion of total inputs made up of each of the three components is the same in both the UK and England series
due to data limitations, the quality adjustment is produced using England data only in both England and UK measures
data for goods and services inputs are not available for Northern Ireland and output data for primary care services are not available for Wales
many of the data sources used are produced on a financial year basis, and a process called “cubic splining” is used to impute a quarterly trend which can then be used to construct the calendar year estimates used in the UK measure produce the calendar year figures
It should also be noted that, for the early years of the UK series, output and much of the inputs are calculated solely from data for England as data for Northern Ireland were not included in the measure until financial year ending (FYE) 2004 and data for Scotland and Wales not included until FYE 2005.
Figure 12 shows the inputs, output and productivity series for the UK on a calendar year basis. As a result of England having the largest expenditure weight in the UK measure, the trend for public service healthcare productivity on a UK and calendar year basis is similar to that for England on a financial year basis, with productivity growth increasing as inputs growth slows more than output growth after 2010.
Figure 12: Public service healthcare productivity for the UK on a calendar year basis follows a similar trend to the England figures, with faster productivity growth in the 2010s than the 2000s
Public service healthcare output, inputs and productivity indices and growth rates, UK, 1995 to 2018
Source: Office for National Statistics
Notes:
- Output is quality adjusted.
Download this image Figure 12: Public service healthcare productivity for the UK on a calendar year basis follows a similar trend to the England figures, with faster productivity growth in the 2010s than the 2000s
.png (35.3 kB) .xlsx (20.3 kB)
Data covering the series used in charts earlier in this article are available to download for the UK on a calendar year basis.
Notes for: Healthcare productivity for the UK on a calendar year basis
- While the Centre for Health Economics at the University of York already produce a measure of healthcare productivity for England, there are a number of differences in the data sources and methods used, which are detailed in section 8.
8. Comparisons with other measures of output and productivity
Other healthcare output and productivity measures
The English financial year productivity figure is produced on a similar basis to an alternative healthcare productivity measure produced by the Centre for Health Economics at the University of York in the series Productivity of the English NHS. Both series apply the Atkinson Review framework, and the largest element of the quality adjustment is produced by the University of York and used in both publications. However, the two series provide slightly different estimates of productivity growth.
These differences arise from a number of differences in the source data used in the two publications including:
different sources and methods used in the calculation of output, particularly Hospital and Community Health Services (HCHS)
different data sources used in the calculation of all three components of inputs
while the largest element of the quality adjustment is common between the two productivity measures, there are minor differences in some parts of the quality adjustment and their application to output data
Other Office for National Statistics (ONS) output and productivity measures
No single productivity measure is definitive and productivity measures cannot alone provide a perfectly comprehensive view of service efficiency, as they do not indicate whether the inputs have been purchased at the lowest possible cost, or whether the desired outcomes are achieved through the output provided.
The productivity statistics published in this article are based on a concept of output as measured by government consumption expenditure rather than government or state production. This follows from the submission of the estimates of the volume of government output that are used in this article (prior to any quality adjustment) to the gross domestic product (expenditure) (GDP(E)) side of the UK National Accounts. This means that we are using a measure of government-purchased output, regardless of what type of business unit produced the output. As with other aspects of the methodology employed in producing these statistics, this approach is consistent with that recommended by the Atkinson Review (PDF, 1.08MB).
In the case of healthcare, although most expenditure is used to fund state providers of healthcare services and its administration, there is a growing component of expenditure on private and third sector-provided healthcare services. This is included within government output in our articles, even though it is provided by business units that are classified as private businesses or non-profit institutions serving households (NPISH) in the UK National Accounts, and this is why the term "public service" is used instead of "public sector".
Traditional measures of private sector or whole-economy productivity, including those published by the Office for National Statistics (ONS), use a supply or production framework. These measures of productivity use Standard Industrial Classification (SIC 2007) categories of production as the measure of output and are on a gross value added (GVA) basis. Input measures count the labour (jobs or hours) used in the production of these goods and services to estimate labour productivity series such as those produced by ONS. We also produce Experimental Statistics on market sector multi-factor productivity, which include labour and capital services as inputs.
The interpretation of the expenditure-based productivity estimates presented in this article should therefore be taken as a measure of the productivity of government-funded healthcare services for individuals in the UK (from whatever type of business unit), and not necessarily government-provided services. Caution should be used when considering the differences between productivity measures published using GVA-based measures of output, such as ONS's labour productivity statistics, and the gross output approach used in these public service productivity statistics.
More information on the difference between these approaches is available in a paper we published in May 2020: How to compare and interpret ONS productivity measures.
Nôl i'r tabl cynnwys9. Public service healthcare productivity data
Public service productivity estimates: healthcare, England and UK
Dataset | Released 2 February 2021
Public service healthcare growth rates and indices for inputs, quality and non-quality adjusted output and productivity, totals and by components. Separate data available for England, financial year ending (FYE) 1996 to FYE 2019 and UK, 1995 to 2018.
10. Glossary
Inputs
Inputs areresources used to produce healthcare services. Inputs are not the same as expenditure and instead are expressed in volume terms, so an increase in staff pay will not increase inputs, but an increase in staff numbers will. Inputs can be measured directly, such as by cost-weighted staff numbers or indirectly, using appropriately deflated expenditure.
Public service healthcare productivity
Productivity is a measure of the amount of service provided (which can be either quality-adjusted or non-quality-adjusted output) for the quantity of inputs used. "Public service" relates to the fact that all healthcare services paid by the public sector are included in this measure.
Quality adjustment
In line with the recommendations of the Atkinson Review (PDF, 1.08MB), a quality adjustment is applied to the estimate of healthcare quantity output to control for the success of the service in meeting selected outcomes. For more information Quality adjustment of public service health output: current method.
Quantity output
The quantity of output is the amount of healthcare services provided and is mostly measured using the number of healthcare activities performed, weighted by the cost of each activity.
Weighting
Weighting refers to the relative importance of changes in individual inputs or output components to changes in the overall inputs or output index. The weight assigned is usually based on cost and so an increase of one hip replacement will have a greater effect on output growth respectively than one outpatient consultation.
Nôl i'r tabl cynnwys11. Data sources and quality
Quality and methodology
More quality and methodology information on strengths, limitations, appropriate uses, and how the data were created is available in the Public service productivity: healthcare QMI.
Acknowledgements
The authors would like to thank Adriana Castelli and James Gaughan from the University of York for the provision of quality adjustment data and comments, and colleagues from the Department of Health and Social Care, NHS England and NHS Improvement, NHS Wales, Northern Ireland Executive, Scottish Government and Welsh Government: Alastair Brodlie, Rachel Dolman, Paul Healy, James Gordon, Paudric Osborne, Rachel Rosen, Robert Scott, Bethan Sherwood, Yin Shi and Joel Solway for the provision of output and input data and comments.
Nôl i'r tabl cynnwys