1. Main points
Aggregate UK productivity growth between 2010 and 2017 was largely driven by businesses at the top of the productivity distribution; however, labour productivity growth of these businesses has been lower post-downturn (2010 to 2017) than during the period immediately prior to the downturn (2004 to 2007).
The middle of the labour productivity distribution – between the 40th and 60th percentiles of employees – remained below pre-downturn levels in 2017; in the most recent period (2015 to 2017), the level of labour productivity of the middle third of employees fell in real terms.
Businesses that were older and larger – in terms of employment – were more productive on average in 2017.
Foreign-owned businesses were around 18% more productive than equivalent, domestically-owned businesses, on average between 2006 and 2017.
The composition of the top- and bottom-ranking industries for labour productivity changed very little between 2008 and 2017; the most productive industry divisions were predominantly capital intensive (production), while the least productive were predominantly labour intensive (services).
2. Introduction
Weak productivity growth has been one of the defining characteristics of the UK’s economic performance over the last decade. Average annual labour productivity growth between 2008 and 2018 was around 0.6%, which compares with around 1.8% over the decade prior to 20081.
As productivity growth supports economic growth and is the main source of improving living standards in the long-term, understanding the UK’s recent poor productivity performance is important for policymakers and researchers. To inform the debate surrounding the UK’s “productivity puzzle”, this article uses data from the Annual Business Survey (ABS) to explore productivity trends and distributions for British businesses.
This article extends a series of releases published by the Office for National Statistics (ONS) that explore firm-level productivity, and builds on previous work in three ways. Firstly, developing from ONS (2017a) and ONS (2017b), we extend our analysis to examine changes in this distribution over time – in this work, we draw on Schneider (2018). Secondly, while ONS (2017a) and ONS (2017b) give insight into the relationship between productivity and certain firm characteristics, the analysis was entirely descriptive. In this article, we explore the relationships between productivity and business types using conditional analysis, which provides a more robust set of results. Thirdly, we draw on new data from the Annual Business Survey for 2017 to provide updated findings.
Consistent with our previous analyses and the wider literature (ONS 2017a, Syverson 2004), our results show that levels of productivity are widely distributed across businesses. The lowest-productivity businesses recorded negative gross value added (GVA) per worker in 2017, while the most productive 10% of workers in the UK recorded GVA per worker of more than £100,000 per worker per year. Median gross value added per worker per year was around £28,000 in 2017.
Our analysis shows that some parts of this distribution have made a larger contribution to aggregate productivity growth than others. We estimate that labour productivity among the bottom 90% of employees in 2017 was around the same level as a decade earlier. The limited change the UK recorded in aggregate labour productivity over this period is largely a result of productivity growth at the top of the distribution2. The middle of the labour productivity distribution – between the 40th and 60th percentiles of employees – remained below pre-downturn levels in 2017.
The importance of high-performing businesses to recent aggregate productivity growth notwithstanding, our analysis also suggests that the labour productivity growth of these businesses – covering the top 20% for employees – has been lower post-downturn (2010 to 2017) than during the period immediately prior to the downturn (2004 to 2007). Productivity growth for middling businesses has been particularly stagnant. For the middle third of employees, labour productivity has fallen in real terms in the most recent period (2015 to 2017).
Our conditional analysis of business-level labour productivity confirms many of our earlier findings. We show that firms that are larger – in terms of employment – are more productive. This effect is clearer once controls are added for the industry of a business. We find that businesses that are older also have higher levels of productivity, but that the largest productivity gains occur in the early years of a business’ life. We also find that foreign-owned firms have considerably higher levels of productivity than domestically-owned firms. In 2017, foreign-owned businesses were almost twice as productive as domestically-owned firms on average, although this premium falls to 18% in our conditional analysis3.
We also analyse labour productivity by industry division over the period, finding large differences between industries. Ranking industry divisions by productivity shows that both the bottom 10 and top 10 industries have changed very little over time – this suggests that the underlying factors influencing the productivity levels of industries have remained relatively constant, and systematic. Notably, we find that the top 10 ranks were predominantly capital-intensive (production) industries, while the bottom 10 were predominantly labour-intensive (services) industries.
This article is structured as follows: section 3 gives an overview of the recent literature concerning firm-level productivity distributions and trends; section 4 discusses the data and methods used in this article; section 5 contains the results of our analysis; section 6 gives our conclusions and areas of future work.
Notes for: Introduction
Labour productivity refers to output per worker and the periods covered are Quarter 1 (Jan to Mar) 1998 to Quarter 1 2008 and Quarter 4 (Oct to Dec) 2008 to Quarter 4 2018: Labour productivity, UK: October to December 2018.
As set out in the following sections, we assign the observed level of labour productivity for each business to each of its employees, and calculate points of interest across employees. This has the effect of weighting larger businesses – those which employ more people – more heavily than smaller businesses. It is also appropriate from the perspective of overall labour productivity, which is estimated as the average level of output per worker, rather than per business. Note that aggregate-level productivity will also have been influenced by the public sector and the finance industry, which lie outside the scope of this article.
Controlling for business size (employment), age, industry, region and survey year.
3. Recent literature
A large international literature has documented considerable differences in productivity across businesses – even within relatively tightly-defined industries (see, for example, Syverson 2004, 2011, Hsieh and Klenow 2009, and Berlingieri and others 2017). Recent work by the Office for National Statistics (ONS), policymakers and academics has sought to develop equivalent results for the UK.
ONS (2017a) explores productivity trends and distributions, noting the wide distribution in the level of productivity of businesses. It also focuses on productivity differences by firm size and industry, and records noticeable differences in productivity levels across industry divisions, finding that on average capital-intensive industries have higher levels of productivity than labour-intensive industries. Concerning firm size, ONS (2017a) observes a gap in the level of productivity of micro-firms (one to nine workers) and medium (50 to 249 workers) or large firms (250 or more workers), although this gap is closing over time.
Using similar data, Schneider (2018) shows how the distribution of labour productivity has changed over time, comparing the pre- and post-downturn periods in particular. He notes that aggregate productivity growth in the pre-downturn period was driven by the highest-productivity firms; however, he finds that these frontier firms are growing at a lower rate post-downturn, possibly driving the slowdown in productivity growth.
Complementing these analyses of the whole labour productivity distribution, ONS (2017b) uses the Annual Business Survey (ABS) to focus on businesses in the bottom 10% of the labour productivity distribution. Consistent with ONS (2017a), it finds that micro-firms and labour-intensive industries, particularly the distribution, hotels and restaurants industry, are overrepresented in the bottom 10%. Its analysis of firm-level productivity and age finds that younger firms were particularly over-represented in the bottom 10% of firms.
The ONS has also examined the link between a wider array of firm-level characteristics and their productivity. ONS (2018) presents the results of new, official collections of quantitative data on the use of structured management practices at UK businesses. They find a positive association between management and productivity, indicating that businesses that make greater use of structured management practices tend to have higher levels of productivity than those that do not. ONS (2017c) combines detailed data on foreign direct investment (FDI) inflows and outflows at the business level with estimates of productivity. It concludes that even when controlling for firm characteristics, firms that engage in FDI – either inward or outward – are 73% more productive than those that do not.
Finally, Wales and others (2018) combine information about business-level productivity with detailed data on trade in goods flows to and from the UK. This article shows that businesses that export and import goods are around 21% and 20% more productive than businesses that record no international goods trade, respectively.
Nôl i'r tabl cynnwys4. Data
To estimate firm-level labour productivity – the ratio of value added to a measure of labour input – business-level information on financial performance and employment are needed. In this article, the Annual Business Survey (ABS)1 provides information on turnover and intermediate purchases, which can be used to estimate businesses’ approximate gross value added (aGVA)2. The ABS is the main structural business survey conducted by the Office for National Statistics (ONS), surveying around 62,000 businesses in the non-financial business economy, covering approximately two-thirds of the UK economy3. We focus our analysis on businesses in Great Britain and exclude industries that have only partial coverage: including industry divisions 1 – agriculture – and section K – financial and insurance activities. Section L – real estate activities – is also excluded from this analysis. This provides an average of around 45,000 business-level observations per year over the 2006 to 2017 period.
The measure of labour input we use is a simple employment headcount – including both employees and working proprietors, full-time and part-time workers. This was obtained from the Inter-Departmental Business Register (IDBR) at the time of sample selection of the ABS. Employment information from the IDBR is derived from a number of different sources (including the Business Register Employment Survey (BRES), HM Revenue and Customs (HMRC) records and some imputation) and some of the employment information – especially for small businesses – may be several years old. Despite this limitation, the IDBR is, at present, the most comprehensive source of employment information for analysis at the reporting unit level, although results generated from this source need to be treated with appropriate caution. The measure of labour productivity used in this analysis is simply the aGVA of a business divided by their employment.
A number of firm characteristics are also obtained from the IDBR. Business-level industry information (five-digit Standard Industrial Classification (SIC)) is taken from the IDBR, from which we construct more aggregated industry groupings. We also derive a variable for the age of a business as the difference between the survey year and the business’ birth date recorded on the IDBR. Finally, the IDBR provides a variable to identify firms that are foreign-owned. This differs from the measure used in ONS (2017c) in that it refers to ultimate foreign ownership – not immediate foreign ownership – and does not capture outward foreign direct investment (FDI) of British businesses.
In this analysis we present measures of labour productivity in current and constant prices. We deflate aGVA from the ABS using a set of experimental industry deflators4. These deflators were derived by allocating national accounts product-level deflators to industries, weighting them using information on industry-level output shares from the supply and use framework. As such, these deflators are constant across businesses in the same industry and survey year.
Unless otherwise stated, the results in this article are weighted to reflect total employment: that is, we assign the observed level of labour productivity for each business to each of its employees, and calculate points of interest across the ranks of employees. This has the effect of weighting larger businesses – those that employ more people – more heavily than smaller businesses. It is also appropriate from the perspective of overall labour productivity, which is estimated as the average level of output per worker, rather than per business.
Finally, recent changes to these data sources – in particular, the re-optimisation of the ABS sample in 20165 – have had some impact on our analysis. The change to the structure of the ABS sample – which affects the 2016 and 2017 estimates – involved two changes:
a reduction in the number of micro- (one to nine workers) businesses sampled, with a corresponding increase in the number of larger businesses
businesses that have a registered Pay As You Earn (PAYE) scheme with HMRC, but are not registered for VAT were added to the ABS universe – 99.3% of these businesses were micro-businesses
The simultaneous reduction in the sample of micro-businesses and the addition of a new group of micro-businesses to the ABS universe has complicated this analysis. In particular, it is difficult to distil changes in the overall performance of micro-businesses into those due to changes in methods and those due to changes in underlying performance.
In our results, we find a notable fall in both mean and median productivity of micro-businesses in 2016, which may be linked to the previously described changes to the ABS. We find that micro-businesses registered solely for PAYE have lower levels of productivity on average than other micro-businesses, indicating that their inclusion is likely to act as a drag on the productivity of this group. We also observe that the reduction in the number of micro-businesses sampled has increased the standard errors of our productivity estimates for 2016 and 2017, likely reflecting an increase in the volatility of this series.
In an attempt to mitigate these effects, we conducted several robustness checks. Firstly, we excluded PAYE-only businesses from the results for 2016 and 2017, so as to ensure consistency in the ABS universe, and reweighted the remaining observations accordingly. We also excluded businesses that record zero turnover and purchases in a period. However, even when these businesses are removed, the fall in micro-business productivity is still observed.
We also assessed the likelihood that the reduction in sample size – and a consequent increase in volatility – might be driving the fall in micro-business productivity. To test this, we drew sub-samples of micro-business ABS data from previous years and used bootstrapping techniques to compare the distribution of resulting productivity estimates for previous years with the more recent data. This work indicated that a fall in micro-business labour productivity remained, even after accounting for the change in the sample size through time6.
Notes for: Data
For full details, refer to the Annual Business Survey Quality and Methodology Information.
GVA from the ABS is referred to as aGVA to differentiate it from the national accounts measure, of which aGVA is a component. The differences between aGVA and the national accounts measure of GVA is discussed in Ayoubkhani (2014).
The industries covered by the ABS are non-financial services, distribution, production, construction and parts of agriculture.
Annual Business Survey: UK non-financial business economy, 2016 revised results
Using bootstrapping methods, we find that there is a 1.2% likelihood that we do not observe a fall in productivity in 2016.
5. Results
Productivity trends across the ABS population
Consistent with earlier work, we find that levels of labour productivity vary widely across businesses (Figure 1). Businesses at and below the fifth percentile recorded negative labour productivity in 2017, while the most productive 10% of workers generated value added in excess of £100,000 per worker per year1. In real terms, median labour productivity was around £28,000 per worker per year in 2017, unchanged from the previous year.
Despite little change at the median, the shape and position of this distribution has changed somewhat over the past decade. With the onset of the economic downturn, productivity fell across the majority of the distribution – low-productivity and high-productivity businesses alike were affected. This is shown by the downward and rightward shift between 2007 and 2009: reducing the number of employees at higher levels of labour productivity.
Since the downturn, the extent of the recovery varies across the distribution. In 2017, businesses at the top tail of the distribution – the highest-productivity businesses – and the lower tail – the least-productive businesses – were more productive than their pre-downturn counterparts; over these portions of the horizontal axis, the more recent cumulative distribution lines are above their earlier equivalents. However, the middle of the productivity distribution saw relatively little recovery, with the level of productivity between the 40th and 60th percentiles remaining marginally lower in 2017 than in 2007.
Figure 1: Businesses at the top and bottom of the productivity distribution were productive than their pre-downturn counterparts, in 2017
2007 to 2017, constant price, Great Britain
Source: Office for National Statistics - Annual Business Survey (ABS), Inter-Departmental Business Register (IDBR)
Notes:
- This chart does not display the bottom one and top five percentiles of the distribution.
- Businesses can have negative levels of value added per worker in specific periods when they report larger values of purchases than their total turnover.
- Includes all businesses covered by the Annual Business Survey (ABS) excluding sections K (Financial and insurance activities) and L (Real estate activities). Businesses that record zero turnover and purchases in a period are excluded.
- The data are in 2016 constant prices and weighted by ABS sample weights and employment.
Download this chart Figure 1: Businesses at the top and bottom of the productivity distribution were productive than their pre-downturn counterparts, in 2017
Image .csv .xlsTo examine these changes in the distribution of labour productivity in more detail, we follow Schneider (2018) and present the average annual change in the level of productivity at each centile of the productivity distribution (Figure 2). This approach – which shows the between-year differences in the curves in Figure 1 – allows easy observation of how levels of labour productivity among the most- and least-productive employees in Great Britain has changed over time.
The most striking feature of Figure 2 is the negative effect of the economic downturn on the productivity distribution. All but the lower tail of the distribution experienced a fall in productivity between 2007 and 2009, pointing to a widespread shock, which affected businesses across the economy. In level terms, the fall in productivity was greatest for the very highest-productivity businesses: the fall in productivity at the median worker was around £2,500 per worker per year, but at the 95th percentile it was closer to £9,000 per worker per year. However, in percentage terms, the size of the fall in productivity was fairly similar across businesses – if slightly smaller for the highest-performing firms2.
Secondly, Figure 2 suggests that changes in productivity levels before and after the economic downturn were quite concentrated. In both the pre- and post-downturn period, changes in the level of productivity were largest at the top of the distribution – among businesses accounting for the top 20% of employees. By contrast, productivity was fairly stagnant across much of the rest of the distribution. In the most recent period (2015 to 2017), the middle third of the distribution (33rd to 67th percentiles) experienced a fall in the level of productivity.
Figure 2: Changes in the level of productivity were largest at the top of the productivity distribution
2000 to 2017, constant price, Great Britain
Source: Office for National Statistics - Annual Business Survey (ABS), Inter-Departmental Business Register (IDBR)
Notes:
- This chart does not display the top and bottom two percentiles.
- This chart excludes the period 2009 to 2010. The majority of the recovery of labour productivity following the economic downturn is concentrated in this period, rendering it less comparable with the periods presented.
- Includes all businesses covered by the Annual Business Survey (ABS) excluding sections K (Financial and insurance activities) and L (Real estate activities). Businesses that record zero turnover and purchases in a period.
Download this chart Figure 2: Changes in the level of productivity were largest at the top of the productivity distribution
Image .csv .xlsAs these changes reflect the contributions of different businesses to aggregate UK productivity, Figure 2 also suggests that some parts of the distribution have made a larger contribution to overall productivity growth than others. In particular, Figure 2 suggests that the most productive businesses made quite a large contribution to aggregate productivity growth immediately prior to the downturn (between 2004 and 2007), and that this contribution has fallen somewhat in the post-downturn period.
This result is consistent with Schneider (2018) – who also found that the contribution of the most productive businesses had fallen somewhat in the post-downturn period. Extending this analysis further back in time indicates that at least some of this contribution may have been a temporary phenomenon. The contributions distribution in Figure 2 for 2000 to 2004 is quite similar to that for the post-downturn period (excepting the very highest-productivity businesses), which may indicate that 2004 to 2007 was a period of unusually strong growth at the top of the labour productivity distribution.
To examine this further, Figure 3 compares aggregate labour productivity growth as measured by the Annual Business Survey (ABS) (population) with that achieved by the bottom 90% of employees (that is, excluding the very highest-productivity businesses), relative to their respective levels in 2007. This presentation makes clear that the highest-productivity businesses supported productivity growth over the post-downturn period.
Labour productivity for the population as a whole (including the highest-performing businesses) was around 8 percentage points higher in 2017 than in 2007, but for the bottom 90% of employees it only recovered to around its pre-downturn level. However, whether this support, from the most productive businesses, was greater or less than the pre-downturn average depends on the comparison period.
Figure 3: The highest productivity businesses supported productivity growth over the post-downturn period
2000 to 2017, constant price, Great Britain
Source: Office for National Statistics - Annual Business Survey (ABS), Inter-Departmental Business Register (IDBR)
Notes:
- Includes all businesses covered by the Annual Business Survey (ABS) excluding sections K (Financial and insurance activities) and L (Real estate activities).
- The data exclude the top and bottom one per cent of businesses in terms of productivity and businesses that record zero turnover and purchases in a period.
- The data are in 2016 constant prices and weighted by ABS sample weights and employment.
Download this chart Figure 3: The highest productivity businesses supported productivity growth over the post-downturn period
Image .csv .xlsProductivity by firm characteristics
The striking variation in business-level productivity shown in the previous sections raises questions about our understanding of the economic processes that support this variation. Economic theory predicts that over time, more-productive businesses should grow in size and market share – drawing in a growing fraction of factor inputs and accounting for a larger share of total output – while less-productive businesses will see their factor input and total output shares shrink. The finding of wide and persistent productivity variations across businesses suggests either that the forces that re-allocate resources across businesses are not as strong as they might be, or that there are some factors that do not move readily across businesses or industries.
To better understand the variation in productivity at the business level, the following sections examine labour productivity for different groups of firms. Table 1 summarises mean and median gross value added (GVA) per worker for businesses of different sizes, for different ages and with different foreign direct investment (FDI) relationships in 2017. A wider range of productivity metrics (including firm- and worker-weighted estimates) are included in the datasets attached to this release. The following sections take these three characteristics in turn, and provide some brief commentary on our findings.
| GVA per worker (£000) | ||
| Employment band | Mean | Median |
| 1 to 9 | 43.4 | 24.0 |
| 10 to 49 | 45.4 | 29.4 |
| 50 to 99 | 53.0 | 35.0 |
| 100 to 249 | 53.4 | 36.7 |
| 250 to 999 | 56.6 | 37.0 |
| 1000 and over | 45.5 | 27.5 |
| GVA per worker (£000) | ||
| Age band | Mean | Median |
| 2 years or younger | 41.7 | 24.3 |
| 3 to 5 years | 43.2 | 24.6 |
| 6 to 10 years | 55.2 | 29.1 |
| 11 to 20 years | 50.6 | 25.9 |
| 21 years or older | 51.2 | 33.4 |
| GVA per worker (£000) | ||
| Ownership | Mean | Median |
| Domestic | 43.8 | 27.1 |
| Foreign owned | 79.4 | 41.7 |
Download this table Table 1: In 2017, businesses that were larger, older and foreign-owned were more productive, on average, 2017, current price, Great Britain
.xls .csvSize
Consistent with our earlier findings and those in the wider literature, we find that firms that are larger – in terms of employment – are more productive on average (Table 1).
Mean labour productivity at businesses with between 250 and 999 workers was around 30% higher than that of the smallest businesses in 2017, and around half as productive again at the median. However, this trend only extends to businesses with fewer than 1,000 workers: Table 1 suggests that the largest businesses are much less productive than those with 250 to 999 workers and are more comparable with micro (one to nine workers) and small-sized (10 to 49 workers) firms in labour productivity terms.
This result appears to be driven by the industrial composition of the largest firms. Five industries (47 – Retail trade; 85 – Education, 78 – Employment activities; 81 – Services to buildings and landscape activities; 56 – Food and beverage service activities) accounted for a large share of this size band (1,000 and over workers): amounting to around 40% of total businesses in this size bracket and around 50% of total employment in this group in 2017. These are low productivity industries3.
To isolate the association between size and productivity more clearly, Figure 4 presents the results of conditional analysis, which compares the relative size of businesses (horizontal axis) with the relative productivity of those same businesses (vertical axis), after controlling for their industry and the survey year. Firms to the left (bottom) of this plot have lower employment (lower productivity) than the average for their industry, while businesses to the right (top) of this plot are larger (have higher productivity).
This depiction shows that, when industry and survey year are controlled for, there is a positive relationship between size (employment) and productivity, but that this does not appear to hold for micro (one to nine workers) businesses. This relationship is concave, suggesting that this relationship is weaker the larger the business. Larger firms can be more productive due to economies of scale: reduced input costs, specialisation of the labour force and increased ability to invest in technology.
Figure 4: Larger businesses are more productive than smaller businesses, on average
2006 to 2017, constant price, Great Britain
Source: Office for National Statistics - Annual Business Survey (ABS), Inter-Departmental Business Register (IDBR)
Notes:
- This chart shows the relationship between employment and labour productivity, after controlling for industry and survey year. It was created using the ‘binscatter’ Stata package. This process first calculates the residuals of log employment and log labour productivity after controlling for industry and survey year. It then splits observations into 50 bins according to log employment and calculates the mean residual of log employment and mean residual of log labour productivity in each bin.
- Includes all businesses covered by the Annual Business Survey (ABS) excluding sections K (Financial and insurance activities) and L (Real estate activities).
- The data exclude the top and bottom 1% of businesses in terms of productivity and businesses that record zero turnover and purchases in a period.
- The data are in 2016 constant prices and weighted by ABS sample weights and employment.
Download this chart Figure 4: Larger businesses are more productive than smaller businesses, on average
Image .csv .xlsAge
The results in Table 1 suggest that labour productivity was higher for older businesses than for younger businesses in 2017: mean productivity at the oldest businesses in this table was around 20% higher than at the youngest businesses over this period, and this difference widens at the median.
This relationship appears to be robust to the inclusion of survey year and industry controls (Figure 5). These controls help to account for differences in the start-up rates of businesses of different types through time, and for changing economic conditions.
Using a similar approach to Figure 4, Figure 5 indicates a positive relationship between age and productivity. As with size, the relationship between labour productivity and age is concave – indicating that the positive association between age and productivity is weaker for older businesses. The extent to which this reflects learning – that businesses get more productive as they get older – or whether it reflects the closure of less-productive businesses over time is difficult to isolate: both are plausible channels.
Figure 5: Older businesses are more productive than younger businesses, on average
2006 to 2017, constant price, Great Britain
Source: Office for National Statistics - Annual Business Survey (ABS), Inter-Departmental Business Register (IDBR)
Notes:
- This chart shows the relationship between employment and labour productivity, after controlling for industry and survey year. It was created using the ‘binscatter’ Stata package. This process first calculates the residuals of age and log labour productivity after controlling for industry and survey year. It then splits observations into 50 bins according to age and calculates the mean residual of age and mean residual of log labour productivity in each bin.
- Includes all businesses covered by the Annual Business Survey (ABS) excluding sections K (Financial and insurance activities) and L (Real estate activities).
- The data exclude businesses that are aged 24 or above; the top and bottom 1% of businesses in terms of productivity; businesses that record zero turnover and purchases in a period.
- The data are in 2016 constant prices and weighted by ABS sample weights and employment.
Download this chart Figure 5: Older businesses are more productive than younger businesses, on average
Image .csv .xlsForeign ownership
ONS (2017c) gives considerable insights into the relationship between foreign direct investment (FDI) and productivity. Consistent with these results, we find that foreign-owned firms have considerably higher levels of productivity than domestically-owned firms. In 2017, foreign-owned businesses were, on average, almost twice as productive as domestically-owned firms (Table 1). Foreign-owned businesses may have access to cheaper inputs, more structured management practices or access to more advanced technologies or processes, which allow them to be more productive.
Industry
Labour productivity is also known to vary greatly by industry for a number of reasons, not limited to: capital intensity, the characteristics of firms, market structure, the nature of competition in the industry, regulation, and industry-specific shocks. To present this variation and how it has changed over time, we have ranked each industry division according to their level of labour productivity in each year4 – this is presented in the subsequent analysis. Figure 6 presents the top-ranking industry divisions in terms of labour productivity in 2008 or 2017, along with their rank in the intervening years. Most apparent from Figure 6 is that the composition of industries in the top 10 ranks has changed very little. Only the 11 industry divisions presented in Figure 6 were ranked in the top 10 across the whole period.
Figure 6: The top ranking industries by productivity have changed very little over time and are predominantly capital-intensive (production) industries
2008 to 2017, current price, Great Britain
Embed code
Source: Office for National Statistics - Annual Business Survey (ABS), Inter-Departmental Business Register (IDBR)
Notes:
Key:
05-09 – Mining and quarrying
11 – Manufacture of beverages
19 – Manufacture of coke and refined petroleum products
20 – Manufacture of chemicals and chemical products
21 – Manufacture of basic pharmaceutical products and pharmaceutical preparations
35 – Electricity, gas, steam and air conditioning supply
36 – Water collection, treatment and supply
50 – Water transport
61 – Telecommunications
63 – Information service activities
77 – Rental and leasing activitiesThe rankings and levels of productivity displayed are based on a 3-year rolling average. Industries are presented here if they ranked in the top 10 in either 2008 or 2017. The full industry rankings are given in the accompanying data download.
Includes all businesses covered by the Annual Business Survey (ABS) excluding sections K (Financial and Insurance Activities) and L (Real Estate Activities). Further industry divisions are grouped or excluded for disclosure reasons.
The data exclude the top and bottom one per cent of businesses in terms of productivity and businesses which record zero turnover and purchases in a period.
The data are weighted by ABS sample weights and employment.
Figure 7 presents equivalent metrics for those industry divisions that ranked in the bottom 10. As with the top 10 industries, there has been very little variation in the composition of industries in the bottom 10, across the period. Of those ranked in the bottom 10 in 2008, nine still remained in the bottom 10 in 2017. Additionally, for all years, the nine lowest ranks are filled by the 11 industry divisions shown here.
Notably, all of the industry divisions in the bottom 10 chart (Figure 7) are labour-intensive (services) industries, while the industry divisions in the top 10 chart (Figure 6) are predominantly capital-intensive (production) industries – 7 out of 11.
Figure 7: The bottom ranking industries by productivity have changed very little over time and are predominantly labour-intensive (services) industries
2008 to 2017, current price, Great Britain
Embed code
Source: Office for National Statistics - Annual Business Survey (ABS), Inter-Departmental Business Register (IDBR)
Notes:
Key:
47 – Retail trade, except of vehicles and motorcycles
56 – Food and beverage service activities
78 – Employment activities
80 – Security and investigation activities
81 – Services to buildings and landscape activities
85 – Education
87 – Residential care activities
88 – Social work activities without accommodation
91 – Libraries, archives, museums and other cultural activities
93 – Sports activities and amusement and recreation activities
94 – Activities of membership organisationsThe rankings and levels of productivity displayed are based on a 3-year rolling average. Industries are presented here if they ranked in the bottom 10 in either 2008 or 2017. The full industry rankings are given in the accompanying data download.
Includes all businesses covered by the Annual Business Survey (ABS) excluding sections K (Financial and Insurance Activities) and L (Real Estate Activities). Further industry divisions are grouped or excluded for disclosure reasons.
The data exclude the top and bottom one per cent of businesses in terms of productivity and businesses which record zero turnover and purchases in a period.
The data are weighted by ABS sample weights and employment.
Regression analysis
To assess the strength and robustness of the previous findings, we combine the full range of firm-level characteristics to which we have access in a single regression framework, the results of which are set out in Table 2. In these regressions, we increase the range of information included in our analysis across the specifications to identify the strongest correlates with productivity.
These results show that the relationships found in the previous descriptive work hold even when controlling for other firm characteristics. We find a positive, but concave, relationship between size (employment) and productivity as in Figure 4. We find a similar relationship between age and productivity, as we observe in Figure 5. We also find a significant, positive productivity premium associated with foreign-owned businesses: this result suggests that a foreign-owned business is around 17.9% more productive than an equivalent, domestically-owned business.
| Log GVA per worker | |||||
|---|---|---|---|---|---|
| (1) | (2) | (3) | (4) | (5) | |
| Log employment | 0.129*** | 0.062*** | 0.097*** | ||
| (0.01) | (0.01) | (0.01) | |||
| Log employment squared | -0.007*** | -0.005*** | -0.005*** | ||
| (0.00) | (0.00) | (0.00) | |||
| Age | 0.027*** | 0.017*** | 0.018*** | ||
| (0.00) | (0.00) | (0.00) | |||
| Age squared | -0.001*** | -0.000 | -0.000*** | ||
| (0.00) | (0.00) | (0.00) | |||
| Foreign owned | 0.269*** | 0.462*** | 0.179*** | ||
| (0.01) | (0.02) | (0.01) | |||
| Industry controls | Yes | Yes | Yes | No | Yes |
| Region controls | Yes | Yes | Yes | No | Yes |
| Year controls | Yes | Yes | Yes | Yes | Yes |
| R-squared | 0.260 | 0.249 | 0.250 | 0.040 | 0.265 |
| Observations | 493667 | 493667 | 493667 | 493667 | 493667 |
Download this table Table 2: Businesses that are larger, older and foreign-owned are more productive, on average, 2006 to 2017, constant price, Great Britain
.xls .csvAs is evident from Table 2, much of the explanatory power in these regressions is provided by the inclusion of industry-level fixed effects. The coefficients on these control variables provide a measure of relative productivity for an industry, after removing firm-specific effects5.
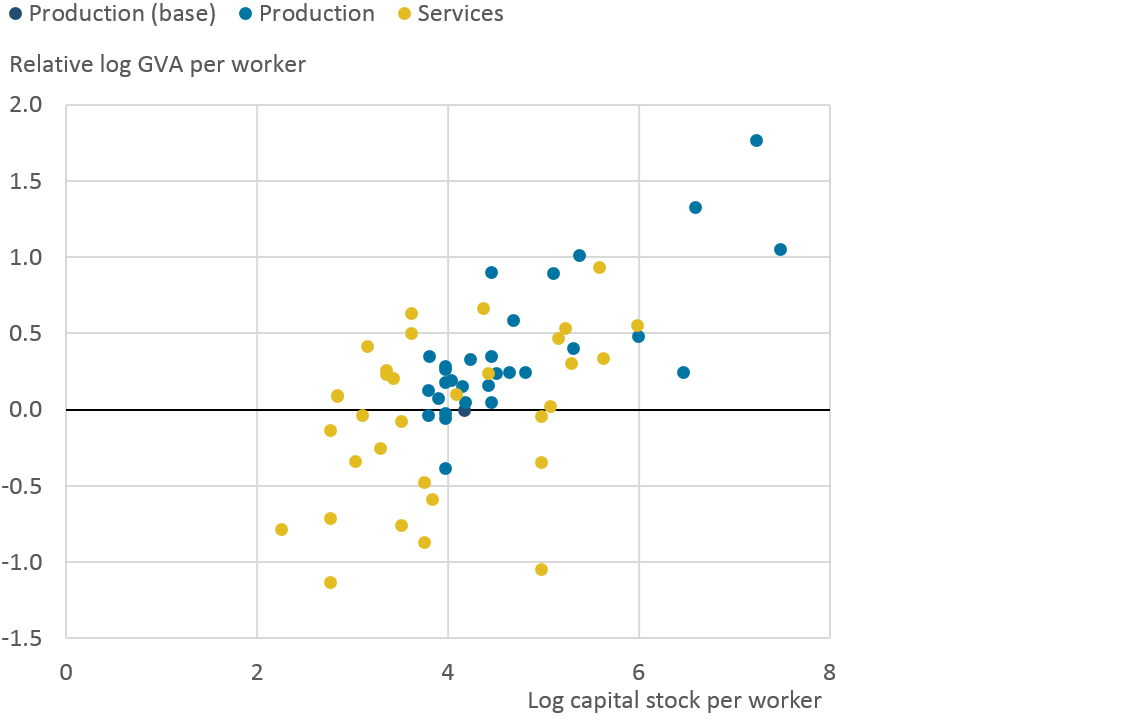
Figure 8 presents this relative productivity against a measure of capital intensity of the industry6 and indicates that industry productivity increases with the level of capital intensity in the industry, regardless of the types of businesses in the industry. We are planning further work to develop firm-level estimates of the capital stock, which should improve our understanding of firm-level productivity performance.
Figure 8: Industries that have higher levels of capital intensity have higher relative levels of labour productivity
2006 to 2017, constant price, Great Britain
Source: Office for National Statistics - Annual Business Survey (ABS), Inter-Departmental Business Register (IDBR)
Notes:
- Relative labour productivity is derived as the industry-specific coefficient from the OLS regression in Table 2 – ‘Forestry and fishing’ is used as the base against which all other industries are compared.
- Includes all businesses covered by the Annual Business Survey (ABS) excluding sections K (Financial and insurance activities) and L (Real estate activities). Further industry divisions are grouped or excluded for disclosure reasons.
- The data exclude the top and bottom one per cent of businesses in terms of productivity and businesses that record zero turnover and purchases in a period.
- The data are in 2016 constant prices and weighted by ABS sample weights and employment.
Download this image Figure 8: Industries that have higher levels of capital intensity have higher relative levels of labour productivity
.png (35.7 kB)
Notes for: Results
Firms can have negative levels of value added per worker in specific periods when they report larger values of purchases than their total turnover.
Note that Figure 2 shows differences in the level of labour productivity at each point in the distribution of labour productivity, which will differ from the percentage change in the level at each point in the distribution. Note also that, as Figure 2 is employment-weighted, it can be read as the average contribution of each centile point of the labour productivity distribution to changes in the aggregate level of productivity as measured by the ABS.
All five of these industries can be found on Figure 7, which shows the lowest ranking industries in terms of labour productivity.
Level of productivity in an industry is calculated as a 3-year rolling average. Some industry divisions were excluded due to partial coverage or disclosure reasons. Only the time period 2008-2017 is analysed, to avoid issues arising from SIC conversion between SIC03 to SIC07.
In this analysis, the Forestry and fishing industry is used as the base, against which all other industries are compared.
We define the level of capital stock as the log capital stock per worker in an industry. Data used are the productive capital stock from Capital services estimates (experimental), along with a measure of market-sector productivity jobs.
6. Conclusion
This article has built upon previous work by the Office for National Statistics (ONS) (2017a and 2017b), using the Annual Business Survey (ABS) to explore firm-level labour productivity differences. We extend the scope of previous work to the most recent period – 2017 – and provide more detailed analysis. We explore additional areas of research, analysing the changes in the productivity distribution over time, and analyse a wider range of firm characteristics in conditional analysis with firm-level productivity.
Our results suggest that, across the population, productivity growth since the economic downturn has been supported by the top end of the productivity distribution. We find that productivity growth of the most productive businesses has been lower post-downturn (2010 to 2017) than the period prior to the downturn (2004 to 2007), but more similar to earlier periods. Meanwhile, productivity at the middle of the distribution has fallen in the most recent period (2015 to 2017).
Exploring productivity differences by further firm characteristics, we find that businesses with greater employment have higher levels of productivity. While this relationship appears not to hold for businesses with 1,000 or more workers, this is likely driven by the industrial composition of the largest businesses. We find a positive, but concave, relationship between age and productivity. Furthermore, we find that a foreign-owned business is around 18% more productive than an equivalent, domestically-owned business.
Consistent with ONS (2017a), we find that the most productive industry divisions are predominantly capital-intensive (production), while the least productive are predominantly labour-intensive (services). Extending previous analysis, we find that the composition of the most and least productive industries has changed very little over the period.
Though this article provides a thorough analysis of labour productivity from the ABS, there are some areas that allow for further investigation. While this work displays the disparity of productivity between industries, there is scope to explore the dispersion of productivity within industries. Furthermore, the development of a set of firm-level capital stocks would allow us to analyse businesses’ multi-factor productivity – this may provide particular insight into the productivity differences between certain industries.
Nôl i'r tabl cynnwys7. References
Berlingieri, G., Blanchenay, P., Calligaris, S. and Criscuolo C. (2017), ‘The MultiProd project: A comprehensive overview’ Organisation for Economic Co-operation and Development (OECD) Science, Technology and Industry Working Papers, Number 2017/04, OECD Publishing, Paris
Ayoubkhani, D. (2014), ‘A comparison between Annual Business Survey and National Accounts of Value Added’, Office for National Statistics
Hsieh, C. and Klenow, P. J. (2009), ‘Misallocation and Manufacturing TFP in China and India’, Quarterly Journal of Economics, Volume 124(4), pages 1403 to 1448
Office for National Statistics (2017a), ‘Labour productivity measures from the Annual Business Survey: 2006 to 2015’
Office for National Statistics (2017b), ‘Understanding firms in the bottom 10% of the labour productivity distribution in Great Britain: “the laggards”, 2003 to 2015’
Office for National Statistics (2017c), ‘Foreign direct investment and labour productivity, a microdata perspective: 2012 to 2015’
Office for National Statistics (2018), ‘Management practices and productivity in British production and services industries – initial results from the Management and Expectations Survey: 2016’
Schneider, P. (2018), ‘The UK’s productivity puzzle is in the top tail of the distribution’
Syverson, C. (2004), ‘Product Substitutability and Productivity Dispersion’, Review of Economics and Statistics, Volume 86(2), pages 534 to 550
Syverson, C . (2011), ‘What determines productivity?’ Journal of Economic Literature, Volume 49(2), pages 326 to 365
Wales, P, R Black, T Dolby and G Awano (2018) ‘UK trade in goods and productivity: New findings’, ESCoE Discussion Paper 2018-09
Nôl i'r tabl cynnwys