1. Disclaimer
These Research Outputs are part of the faster indicators of UK economic activity project and are not official statistics. The indicators are still in development and not yet fully in production. We are making these data available at an early stage to invite feedback and comment on their further development.
Back to table of contents2. What are these data?
This is the first timely release of new, faster, indicators of economic activity constructed from novel data sources. This release is part of the Faster indicators of UK economic activity project, led by the Data Science Campus. These indicators are available up to one month in advance of official estimates of gross domestic product (GDP). The release includes indicators constructed from two datasets.
Indicators from HM Revenue and Customs (HMRC) Value Added Tax (VAT) returns:
- monthly and quarterly diffusion indicators from turnover reported on VAT returns, January 2008 to March 2019
- monthly and quarterly diffusion indicators from expenditure reported on VAT returns, January 2013 to March 2019
- VAT reporting types and new VAT reporters, January 2007 to March 2019
Road traffic sensor data for England from Highways England:
- monthly average road traffic counts for England and English port areas, January 2007 to February 2019
- monthly average road speeds for England and English port areas, January 2007 to February 2019
- in addition to the new data for January and February 2019, we have also updated the road traffic indicators for November and December 2018, following an update to these data by Highways England, and we have revised the full time series for the all-ports indicators, following an improvement to our methodology.
Updated indicators constructed using ship tracking data from automated identification systems (AIS) will follow in the coming months.
It is important to note that we are not attempting to forecast or predict GDP or other headline economic statistics here, and the indicators should not be used in this way. Rather, by exploring big, closer-to-real-time datasets of activity likely to have an impact on the economy, we provide an early picture of a range of activities that supplement official economic statistics and may aid economic and monetary policy-makers and analysts in interpreting the economic situation. They should be considered as early warning indicators providing timely insight into real activities in the economy, and their potential impact on headline GDP should be carefully interpreted.
The VAT turnover and expenditure diffusion indices are constructed to have values between [negative 1 and 1], inclusive. If all firms report an increase in the latest period relative to the comparison period, the index would be 1. If all firms report a decline, the index would be negative 1. If an equal number grow and decline, the index would be 0.
A full description of the data, methodology and economic analysis, describing the time series, can be found in Faster indicators of UK economic activity and associated articles.
Back to table of contents3. Main messages from the latest data
The main Value Added Tax (VAT) indicators show a mixed picture for Quarter 1 (Jan to Mar) 2019. Whilst some indicators in the heatmap in Figure 1 are slightly above or below their average values, most indicators are around their average values.
Compared with Quarter 4 (Oct to Dec) 2018, there has been a slight decrease in the overall quarter-on-quarter VAT turnover diffusion index in Quarter 1 2019 and at negative 0.02 it is now slightly below its 2008 to 2018 average. The level of negative 0.02 means that there were very slightly more firms reporting a decline in turnover between Quarter 4 2018 and Quarter 1 2019 than the number of firms reporting an increase in turnover between the two periods.
The number of new VAT reporters fell slightly in March 2019 to around its average 2008 to 2018 level.
In January and February 2019, the average traffic counts for larger vehicles were broadly stable, close to their average between 2016 and 2018.
4. Data analysis
VAT heatmap commentary
Figure 1: The balance of VAT indicators shows a mixed picture for Quarter 1 (Jan to Mar) 2019

Source: HM Revenue and Customs - Value Added Tax returns
Notes:
- Ag - Agriculture, forestry and fishing, All - All industries, Con - Construction, Prod - Production, SA - Seasonally adjusted, NSA - Not seasonally adjusted, R - Repayment claim, Rep - Replacements (tax due & repayment), Ret - Wholesale and retail trade, RI R - Re-input repayment claim, RI T - Re-input tax due, Serv - Services
- *Second month estimate. All other estimates are month 1 (M1) estimates.
- All industries are unweighted: each firm contributing to the index has the same weight regardless of turnover, size or industry.
- The thresholds for the colours in the are based on standard deviations from the mean of the indicator between 2008 and 2018, these are inverted for record type indicators:
Dark blue: level > 1.5 standard deviations above mean
Light blue: 0.5 standard deviations above mean < level < 1.5 standard deviations above mean
Light grey: 0.5 standard deviations below mean < level < 0.5 standard deviations above mean
Light red: 1.5 standard deviations below mean < level < 0.5 standard deviations below mean
Dark red: level < 1.5 standard deviations below mean
Black: no data
Download this image Figure 1: The balance of VAT indicators shows a mixed picture for Quarter 1 (Jan to Mar) 2019
.png (213.3 kB)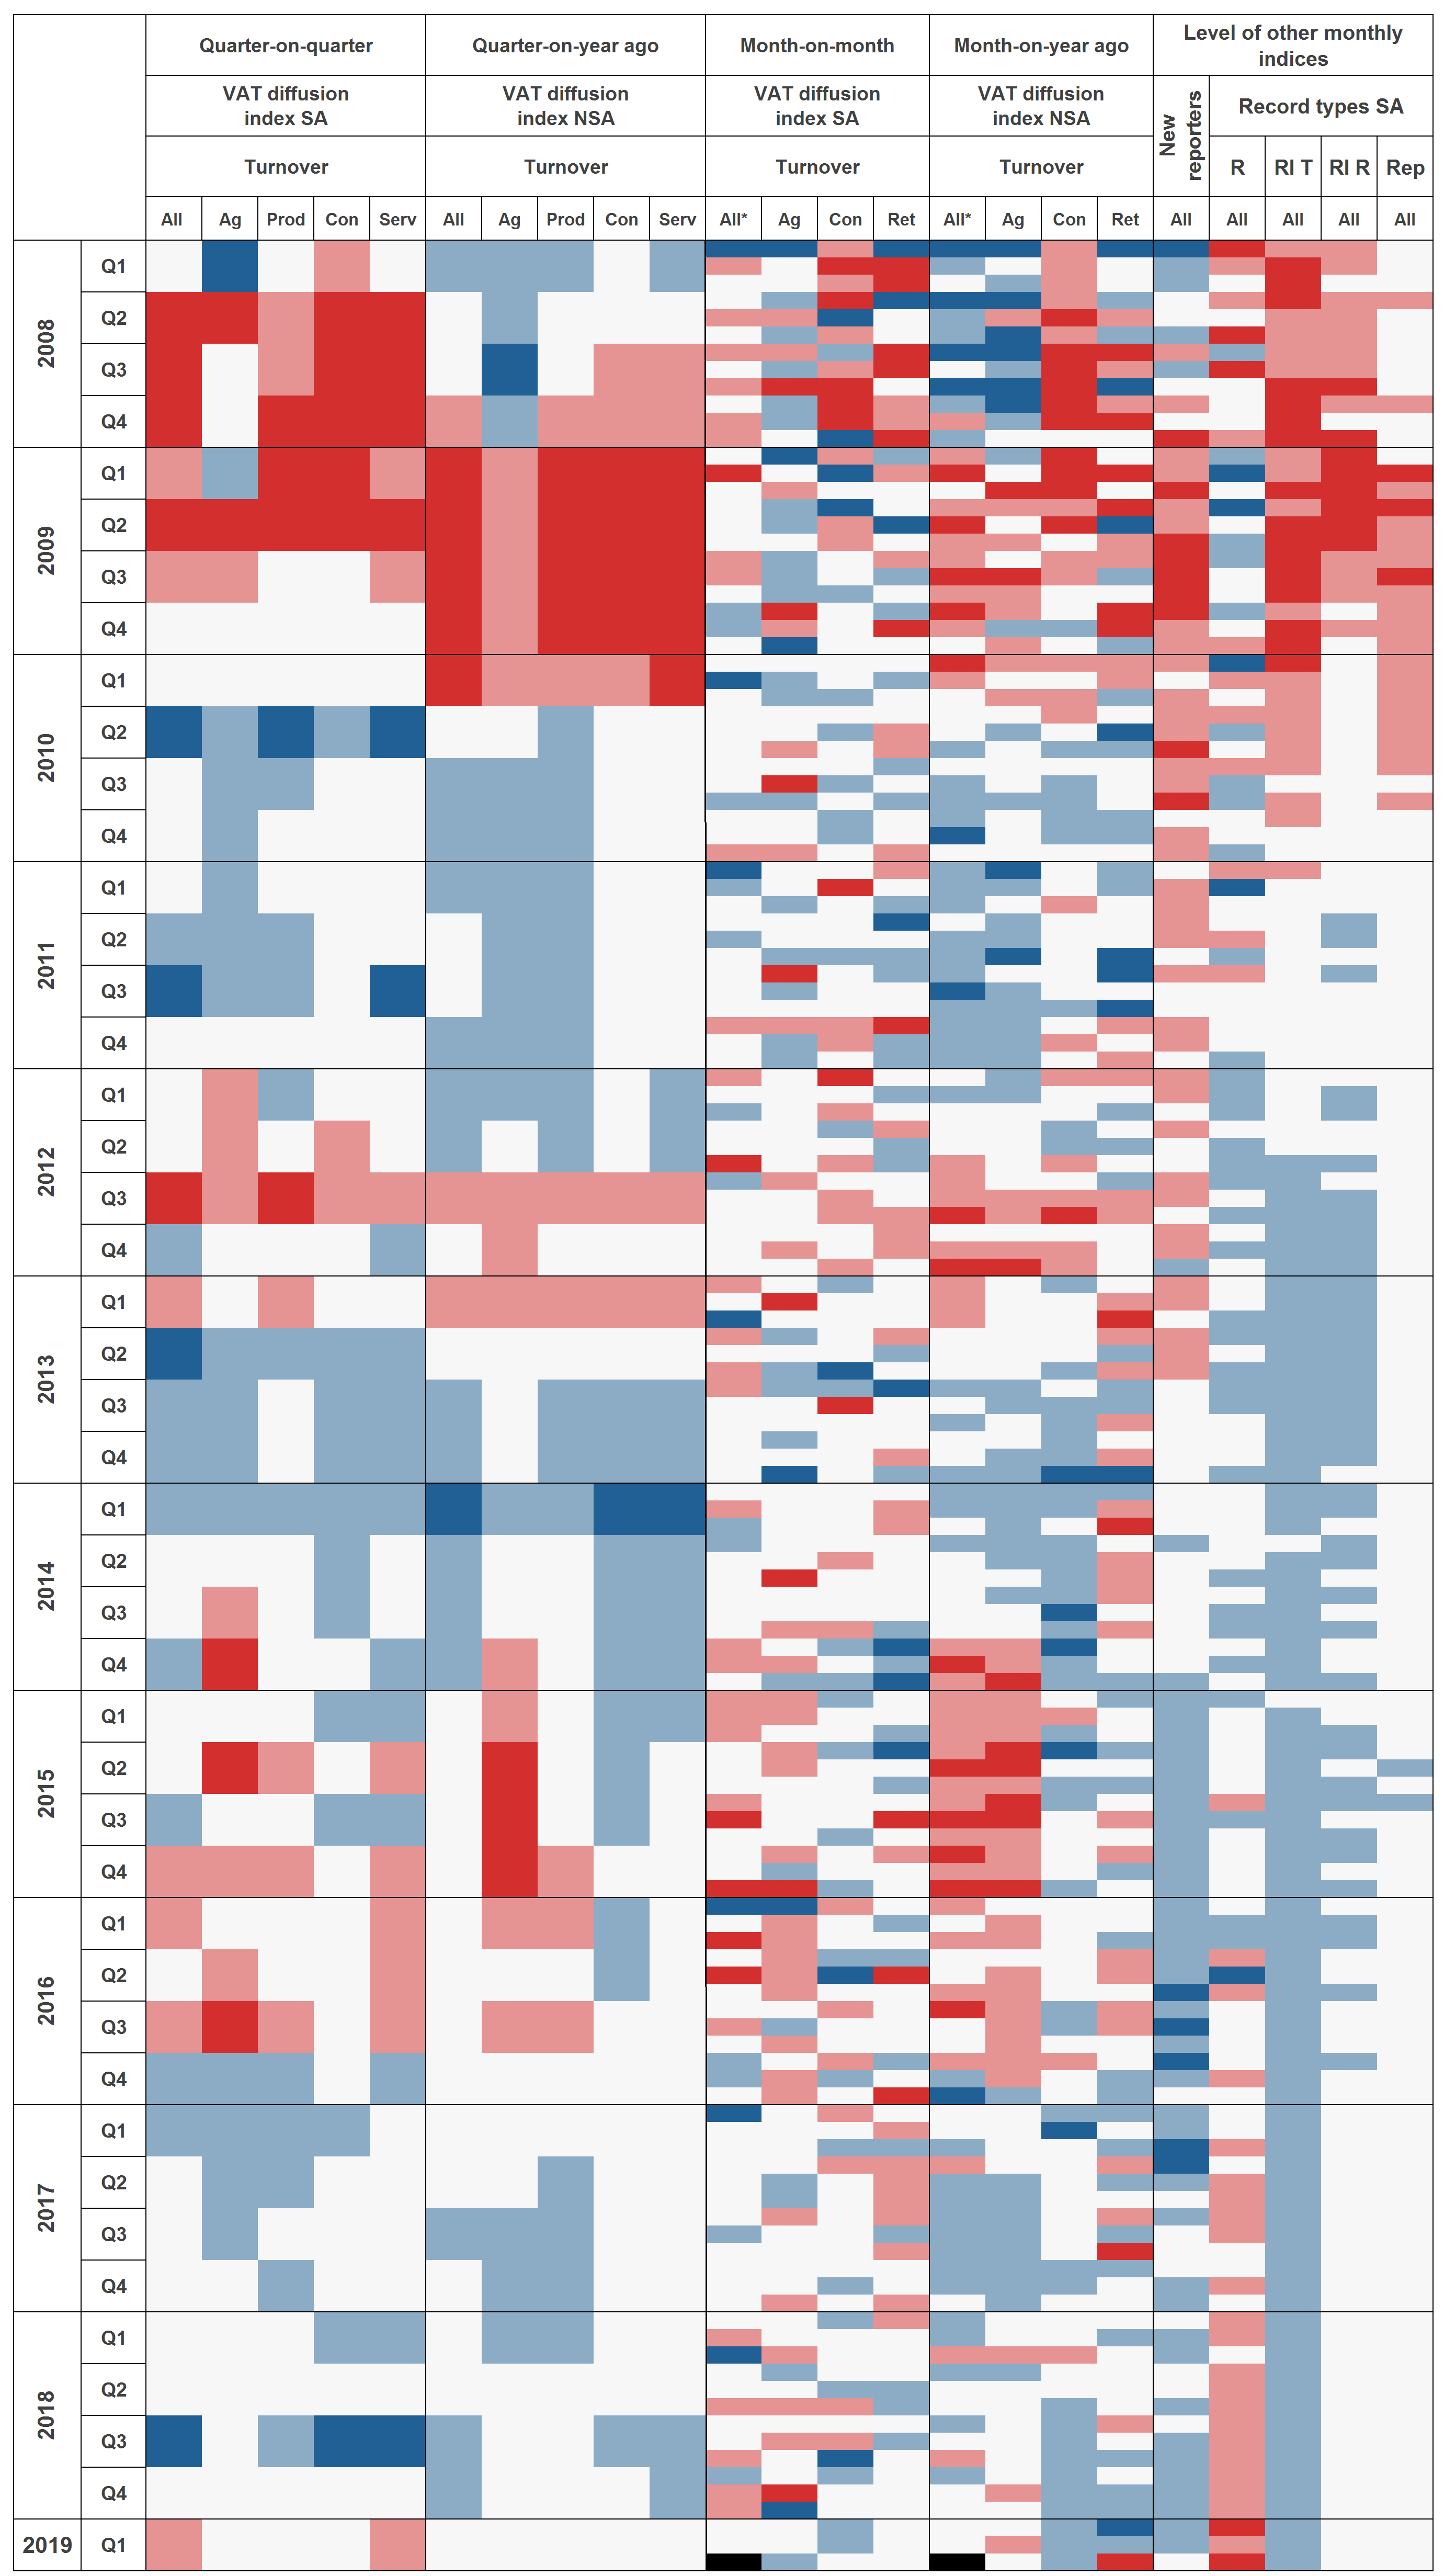
The heatmap in Figure 1 shows the latest available Value Added Tax (VAT) indicators up to and including March 2019. Values around the 2008 to 2018 average are shown in light grey, values that are slightly or considerably below their average are shown in light red and dark red respectively, and values that are slightly or considerably above their average are shown in light blue and dark blue respectively.
The colours for the record types are inverted (red above average, blue below average) as previous analysis has shown a negative relationship between economic activity and the number of firms reporting repayment, re-input or replacement returns.
For the quarter-on-quarter (QoQ) and the month-on-month (MoM) turnover diffusion indices the data are seasonally adjusted (SA), as are the monthly measures of new reporters and record types. Also it should be noted that all VAT diffusion indices are measured in current prices (CP) and therefore include any effects from price changes.
The balance of indicators shows a mixed picture for Quarter 1 (Jan to Mar) 2019 (Figure 1). Most indicators are around their average values and very few of the indicators are currently at values considerably away from their average (either dark blue or dark red).
Compared with Quarter 4 (Oct to Dec) 2018, there has been a slight decrease in the overall (all industries) QoQ turnover diffusion index for Quarter 1 2019 and at negative 0.02 it is now slightly below its 2008 to 2018 average (light red). The level of negative 0.02 means that there were very slightly more firms reporting a decline in turnover between Quarter 4 2018 and Quarter 1 2019 than the number of firms reporting an increase in turnover between the two periods.
All industrial components (agriculture, production, construction, services) recorded a slight decrease in the QoQ turnover diffusion index in Quarter 1 2019, compared with Quarter 4 2018, but the levels for each component are within 0.5 standard deviations of their historic means (light grey), except for services.
It is important to note that because of the staggered method of data collection, the Quarter 1 2019 quarterly diffusion indices are largely based on data referring to January and February, not March.
Looking over a slightly longer time period, the overall (all industries) quarter-on-year (QoY) ago turnover diffusion index fell slightly in Quarter 1 2019 (from light blue to light grey) but at 0.02, the number of firms reporting higher turnover in Quarter 1 2019 than Quarter 1 2018 very slightly exceeds the number of firms reporting lower turnover.
The MoM turnover diffusion index in the agriculture sector (approximately 300 firms reporting) was slightly above its 2008 to 2018 average in March 2019 (light blue). The comparable March indices in the construction sector (approximately 100 firms reporting) and the retail and wholesale sector (approximately 100 firms reporting) were close to their historical averages (light grey). We are only able to publish the monthly diffusion indices for these sectors within one month of the end of the reporting period (March 2019 in this case) as there is an insufficient number of reporters in other sectors. Monthly data to end-February 2019 are available for the other sectors in the data spreadsheet.
Comparing March 2019 and March 2018, the month-on-a year ago (MoY) turnover diffusion index in March 2019 was slightly above its historical average in the construction sector (light blue) and considerably below its historical average in the retail and wholesale sector (dark red).
As well as the diffusion indices we have constructed various measures of reporting behaviour in the VAT data. Previous analysis compared historical trends in all the VAT faster indicators with other economic indicators, such as GDP.
The number of new reporters fell slightly in March 2019 to around its average 2008 to 2018 level (light grey). The number of repayment claims increased in March 2019, continuing its upward trend in recent years, and at 187,170 was over 1.5 standard deviations above its 2008 to 2018 average (173,900), however, it remains considerably below its historic peak of 230,690 in January 2008. The number of firms with re-input tax returns was slightly below its 2008 to 2018 average in March 2019.
The heatmap is a useful visualisation tool to look across the indicators for a common signal. It can also help in identifying changes in particular indicators, which are worth investigating in more detail. This is done in the following section.
VAT detailed commentary
Figure 2: The turnover and expenditure quarter-on-quarter diffusion indices both fell slightly in Quarter 1 (Jan to Mar) 2019
Quarter-on-quarter diffusion indices, seasonally adjusted, current prices, all industries, Quarter 1 (Jan to Mar) 2008 to Quarter 1 (Jan to Mar) 2019, UK
Source: HM Revenue and Customs - Value Added Tax returns
Download this chart Figure 2: The turnover and expenditure quarter-on-quarter diffusion indices both fell slightly in Quarter 1 (Jan to Mar) 2019
Image .csv .xlsFigure 2 shows that the quarter-on-quarter (QoQ) turnover and expenditure diffusion indices in Quarter 1 2019 both fell by 0.01 relative to Quarter 4 2018. VAT expenditure data include intermediate consumption, investment in capital assets and inventories.
The level of the QoQ turnover diffusion index was negative 0.02 in Quarter 1 2019 (Figure 2). As such, there were very slightly more firms reporting a decline in turnover between Quarter 4 2018 and Quarter 1 2019 than the number of firms reporting an increase in turnover between the two periods. The level of the QoQ expenditure diffusion index was negative 0.01 in Quarter 1 2019.
Although the QoQ turnover diffusion index is negative, it is not as negative as it was in the period during the 2008 to 2009 recession where the diffusion index was negative 0.06 in Quarter 2 (Apr to June) 2009. We do not currently have data going back far enough to compare expenditure indices with the 2008 to 2009 recession, however, its Quarter 1 2019 level of negative 0.01 is very close to its 2013 to 2018 average of 0.00.
It is important to note that because of the staggered method of data collection, the Quarter 1 2019 quarterly diffusion indices are largely based on data referring to January and February, not March.
Figure 3: The month-on-month turnover diffusion indices for sectors with March 2019 data show levels relatively close to 0 in Quarter 1 (Jan to Mar) 2019
Month-on-month turnover diffusion indices for industrial sectors with March 2019 data, seasonally adjusted, current prices, January 2008 to March 2019, UK
Source: HM Revenue and Customs - Value Added Tax returns
Download this chart Figure 3: The month-on-month turnover diffusion indices for sectors with March 2019 data show levels relatively close to 0 in Quarter 1 (Jan to Mar) 2019
Image .csv .xlsFigure 4: In March 2019 the month-on-month turnover diffusion index for agriculture increased and for construction decreased
Month-on-month turnover diffusion indices for industrial sectors with March 2019 data, seasonally adjusted, current prices, January 2016 to March 2019, UK
Source: HM Revenue and Customs - Value Added Tax returns
Download this chart Figure 4: In March 2019 the month-on-month turnover diffusion index for agriculture increased and for construction decreased
Image .csv .xlsFigures 3 and 4 show the month-on-month (MoM) turnover diffusion indices for three industrial sectors: agriculture, forestry and fishing; construction; and wholesale and retail trade. We are only able to publish the monthly diffusion indices for these sectors within one month of the end of the reporting period (March 2019 in this case) as there is an insufficient number of reporters in other sectors. Monthly data to end-February 2019 are available for the other sectors in the data spreadsheet.
Across the sectors shown in Figures 3 and 4, the levels of the MoM turnover diffusion indices in Quarter 1 2019 were close to 0 relative to the more extreme values seen in the historical time series, such as in 2008 and 2009. The MoM turnover diffusion index for March 2019 is 0.03 for agriculture, forestry and fishing, negative 0.04 for construction and negative 0.05 for wholesale and retail trade. This means slightly more firms in agriculture, forestry and fishing reported an increase in turnover than reported a decrease, in March 2019 compared with February 2019. For construction, and wholesale and retail trade firms, slightly more of them reported a decrease in turnover in March 2019 compared with the month before than reported an increase in turnover between the months.
For agriculture the positive MoM turnover diffusion index in March 2019 was a change in direction having been negative in both January and February. For construction the March MoM turnover diffusion index was 0.10 lower than the level in February. The wholesale and retail MoM turnover diffusion index was slightly positive in January but negative in both February and March.
Figure 5: Number of new VAT reporters decreased slightly in February and March
Number of new VAT reporters, seasonally adjusted, all industries, January 2007 to March 2019, UK
Source: HM Revenue and Customs - Value Added Tax returns
Download this chart Figure 5: Number of new VAT reporters decreased slightly in February and March
Image .csv .xlsFigure 5 shows the number of new VAT reference numbers appearing in the VAT returns data. This increased slightly in January 2019 but fell in both February and March. The number of new reporters in March 2019 is at its lowest since October 2017. Although the number of new reporters is at its lowest point for over a year, at 19,180 it is still considerably above the overall lowest points for the series of approximately 12,200 seen in March 2009 and September 2010.
Road traffic commentary
Figure 6: Falls in the number of sensor counts can lead to volatility in average traffic counts
Average road traffic counts for all vehicles, seasonally adjusted, and the total number of sensor observations, non-seasonally adjusted, January 2007 to February 2019, England
Source: Highways England - Road traffic sensor data
Download this chart Figure 6: Falls in the number of sensor counts can lead to volatility in average traffic counts
Image .csv .xlsFigure 6 shows that the average traffic count is sensitive to the number of observations, that is, the number of sensor readings that contribute to each month’s traffic flow data. There is a gap in the data between 31 December 2014 and 1 April 2015 when the method of data collection changed. There was a large decline in the number of observations in August 2017 and March 2018 and in these same months there were spikes in the average traffic counts, so these time periods should be interpreted with care. However, the number of observations over recent months has been relatively more stable.
Previous work discussed the data sources and methodology used to construct the road traffic indicators and their historical trends in comparison with other economic indices. In this it was found that the trends in traffic counts for larger vehicles (those over 6.6 metres in length) had a closer relationship with goods imports and exports than traffic counts for smaller vehicles.
Figure 7: Traffic counts for the larger vehicles were broadly stable in January and February 2019
Road traffic counts by vehicle length, seasonally adjusted, January 2007 to February 2019, England. Vehicles over 11.66 metres in length and between 6.6 metres and 11.6 metres in length
Source: Highways England - Road traffic sensor data
Download this chart Figure 7: Traffic counts for the larger vehicles were broadly stable in January and February 2019
Image .csv .xlsFigure 7 shows that in January and February 2019 the average traffic counts for larger vehicles were broadly stable. Over a 15 minute interval at each sensor, in February 2019, there were on average 33.1 vehicles over 12 metres in length and 21.2 vehicles between 7 and 12 metres in length. Excluding the two volatile periods discussed previously due to a low number of observations, these levels are close to the average levels between 2016 and 2018 of 31.8 vehicles over 12 metres in length and 21.3 vehicles between 7 and 12 metres long.
Back to table of contents5. Methodology and quality
VAT indicators
Data source
The Value Added Tax (VAT) indicators are constructed from the VAT returns reported to HM Revenue and Customs (HMRC) by all VAT-registered firms. Details on who reports, the timing of reporting, and differences between the approach used for these indicators and the use of VAT returns in official statistics can be found in Faster indicators of UK economic activity: Value Added Tax returns.
Constructing the VAT diffusion indices
To construct the VAT diffusion index all the firms that are in both the time period of interest (time, t) and the comparison period, for example, the previous month for month-on-month indices, are selected. Firms with 0 values in both periods are excluded. The index for each time period (t) is then constructed using the following formula:
Note that each firm is given equal weight. We do not adjust for the size of firms’ activity.
The formula ensures the indices fall in the interval [negative 1 to 1], inclusive. If all firms report an increase in the latest period relative to the base period, the index would be 1. If all firms report a decline, the index would be negative 1. If an equal number grow and decline, the index would be 0.
Quality
There are four main quality considerations for the VAT indicators.
Although the number of firms included in the indicator is over 250,000 on average for the all-industry quarterly diffusion indicators, the earliest monthly diffusion indicators (month 1, MoM) contain fewer than 100 firms in some periods. The number of firms contributing to each indicator are included in the dataset.
Monthly reporters, used in the monthly diffusion indices, are not representative of the balance of firms across the economy, particularly those reporting in month 1 (within a month). The agriculture, forestry and fishing; construction; and wholesale and retail trade industries dominate the monthly returns in month 1. More generally it is possible that early-reporting firms reporting at all frequencies may have different characteristics from firms reporting later, even in the same industry.
Changes to tax and collection policies may have an impact on the indices that are not related to the underlying economic climate.
The expenditure measure captures all expenditure that must be reported to HMRC for VAT purposes. This means that it is the sum of intermediate consumption, investment in capital assets, and inventories. Care should be taken in interpreting which of these elements changes should be attributed too.
Avoiding the identification of individual firms
Splitting the data by industry occasionally results in only a small number of firms left in the indices. In cases where fewer than 15 firms have reported in a particular component or sector, we suppress the entire series. In the event where only a single series is removed, we also remove the next smallest to prevent any derivation of the suppressed series from the total.
Figures are also rounded, to prevent possible inference of exact values. The diffusion index and percentage of new reporters are rounded to two decimal places, and the number of firms for any measure is rounded to the nearest 10.
It should be noted that for some indicators although they meet these disclosure thresholds, the number of firms contributing can still be low, for instance below 100 firms, so caution is needed in interpreting the data.
Road traffic indicators
Data source
Average counts and average speed data for traffic on English motorways and major A-roads were obtained from Highways England’s TRIS dataset, which lists the roads covered. Traffic flow is measured by induction loop and radar sensors. The data can be split by four categories of vehicle length as follows:
- less than 5.2 metres – for example, cars, motorcycles
- 5.2 metres to 6.6 metres – for example, panel vans, minibus
- 6.6 metres to 11.66 metres – for example, rigid lorries, buses
- greater than 11.66 metres – for example, larger rigid lorries and coaches, articulated lorries
Quality
For the road traffic indicators, there are three main issues that need to be considered when interpreting the data.
Individual sensors can drop out unexpectedly, due, for example, to road works or faults. The missing data can cause gaps in the time series and affect the average values. For example, if sensors drop out in an area of high traffic counts, the overall average will fall, making it difficult to interpret the time series. The total number of counts for each area is included in the dataset.
There was a change to the data collection methodology in 2015, which causes a step change in the time series.
There may be biases in the positioning of the sensors, which could be preferentially deployed to areas of heavy traffic, and, in recent years, to road sections requiring active traffic management.
In our March 2019 road traffic publication, there were significant quality issues with the road traffic data for November and December 2018. Highways England has since updated these data, and this publication includes these updates, as well as new data for January and February 2019.
Seasonal adjustment
Seasonal adjustment for the VAT indicators was performed using the software X-13ARIMA-SEATS. The method of seasonal adjustment used is the X-11 algorithm. The parameters used in the March 2019 publication were fixed for this release.
The monthly road traffic series were seasonally adjusted using the standard JDemetra+ seasonal adjustment package, with default settings. In JDemetra+, missing values are treated as outliers whereas X-13ARIMA-SEATS does not handle missing observations. As the updates for November and December 2018 had a significant impact on the series, parameters were not fixed relative to the March 2019 publication.
This methodology and the new data have led to small changes in the seasonally adjusted series relative to the previous publication.
Further details
Full details of the data, quality, methodology and economic analyses can be found in Faster indicators of UK economic activity and associated articles.
Back to table of contents6. Feedback
We welcome feedback and comments on these indicators, including on presentation, further development or other data sources to investigate. Feedback can be sent to Faster.Indicators@ons.gov.uk.
Back to table of contents