1. Background
In the Labour Force Survey (LFS) respondents are interviewed for five consecutive quarters over a 12 month period, with 20% of the sample being replaced at each quarter. This allows for a longitudinal dataset to be created over a limited time interval, where respondents’ characteristics can be tracked over their time in the survey.
We publish population-weighted longitudinal datasets for each calendar quarter. These are available for each quarter since 1997 and can be used to analyse changes in labour market characteristics over two or five quarters. The datasets include "flow" variables, which estimate the size of the movements between the three main labour market statuses of employment, unemployment and economic inactivity.
Monitoring changes in the labour market status of respondents to the LFS aids the understanding of the quarterly changes in the levels of employment, unemployment and economic inactivity. These indicators are published as stocks for a given period, with changes expressed as the difference between successive quarters. These quarterly comparisons represent the net changes between the three labour market statuses. The underlying gross flows are usually considerably larger and may not correspond with those implied by the net changes. Estimates of the gross flows between the statuses can be derived from the LFS Longitudinal Datasets and are summarised in this note.
Nôl i'r tabl cynnwys2. Method
There are two types of LFS longitudinal datasets: two-quarter and five-quarter. These are weighted using the same population estimates as those used in the main quarterly LFS datasets, although the weighting methodology differs (see technical note). Consequently the estimates are broadly consistent with the published aggregates, but not entirely. Also, the datasets are limited to people aged 16 to 64.
Both types of dataset contain a flow variable with eleven categories, with all combinations of employment, unemployment and economic inactivity accounted for, plus two categories for those entering and leaving the 16 to 64 population over the quarter. For the purpose of this analysis, those entering or leaving this population are excluded from the measured sample. The stock of the employed, unemployed and inactive at each quarter can therefore be estimated by summing the corresponding flow categories.
For this analysis, the two-quarter datasets have been used in order to gain some insight into the quarterly changes in the headline published aggregates.
Nôl i'r tabl cynnwys3. The charts in this article
The charts in this article show the estimated gross flows, that is the total inflow or outflow for 16-64 employment, unemployment and inactivity from one calendar quarter to the next. They are seasonally adjusted. Analysis of the net flows, that is the difference between the total inflow and outflow, are also included and these are compared with the quarterly changes in the published aggregates, partly to give an indication of the robustness of the flows analysis.
Nôl i'r tabl cynnwys4. Main points for quarter 3 2015
the flow from employment to unemployment has decreased to its lowest level since the series began in 2001
the job to job flow is at its highest rate since January to March 2008
the flow from unemployment to inactivity has decreased to its lowest level since April to June 2008
5. Quarterly gross flows
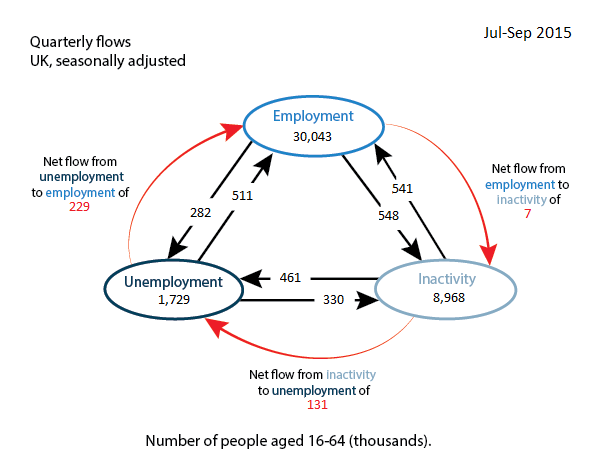
The diagram below shows the gross flow between each economic status between April to June 2015 and July to September 2015. The stocks for each status represent the latter period and are the seasonally adjusted aggregates for people aged 16 to 64.
Quarterly population flows - July to September 2015
United Kingdom, seasonally adjusted (thousands)
Source: Labour Force Survey
Download this image Quarterly population flows - July to September 2015
.png (46.1 kB) .xls (96.3 kB)
6. Unemployment
The flow from employment has decreased to its lowest level since the series began (in 2001). The gross inflow to unemployment is below 800,000 after two previous increases (Figure 1).
Figure 1: Inflow to unemployment
Seasonally adjusted (16 to 64)
Source: Labour Force Survey
Download this chart Figure 1: Inflow to unemployment
Image .csv .xlsThe gross outflow has increased slightly (Figure 2).
Figure 2: Outflow from unemployment
Seasonally adjusted (16 to 64)
Source: Labour Force Survey
Download this chart Figure 2: Outflow from unemployment
Image .csv .xlsFigure 3 shows that the quarterly change in stock and net flow have both decreased by a similar amount.
Figure 3: Unemployment: Net flow vs change in stock
Seasonally adjusted (16 to 64)
Source: Labour Force Survey
Download this chart Figure 3: Unemployment: Net flow vs change in stock
Image .csv .xls7. Employment
The flows to employment from both inactivity and unemployment (Figure 4) increased.
Figure 4: Inflow to employment
Seasonally adjusted (16 to 64)
Source: Labour Force Survey
Download this chart Figure 4: Inflow to employment
Image .csv .xlsThe flow from employment to unemployment (Figure 5) decreased to the lowest level since the series began in 2001.
Figure 5: Outflow from employment
Seasonally adjusted (16 to 64)
Source: Labour Force Survey
Download this chart Figure 5: Outflow from employment
Image .csv .xlsThe job to job flow (Figure 6), that is the number of people who remained in employment over the quarter but are in a different job, increased to its highest rate since January to March 2008.
Figure 6: Job to job flow rate
Seasonally adjusted (16 to 69)
Source: Labour Force Survey
Download this chart Figure 6: Job to job flow rate
Image .csv .xlsFigure 7 shows that the net flow and change in stock have both increased.
Figure 7: Employment: Net flows vs change in stock
Seasonally adjusted (16 to 64)
Source: Labour Force Survey
Download this chart Figure 7: Employment: Net flows vs change in stock
Image .csv .xls8. Inactivity
The flow from unemployment to inactivity (Figure 8) has decreased whereas the gross flow to inactivity remains broadly flat.
Figure 8: Inflow to inactivity
Seasonally adjusted (16 to 64)
Source: Labour Force Survey
Download this chart Figure 8: Inflow to inactivity
Image .csv .xlsThe gross flow from inactivity (Figure 9) has increased driven by the increase to employment.
Figure 9: Outflow from inactivity
Seasonally adjusted (16 to 64)
Source: Labour Force Survey
Download this chart Figure 9: Outflow from inactivity
Image .csv .xlsFigure 10 indicates that the quarterly change in stock and the net flow have decreased and are both negative.